Backtesting and Strategy Analysis
Read at your own pace. Code execution, quizzes, progress tracking, and the AI tutor are available in the interactive view with JavaScript enabled.
Test Before Live
Why this lesson matters
In Implementing Trading Algorithms, you built a strategy layer that can emit trading intent. In Optimization and Performance Tuning, you learned that milliseconds matter and that performance must be measured, not guessed.
Now we connect both ideas: does the strategy actually work on historical data?
Backtesting answers questions like:
- Would this SMA crossover strategy have made money on past prices?
- How often did it trade?
- Did costs erase the edge?
- Was the strategy stable, or did it only work on one lucky period?
A backtest is not a prediction machine. It is a debugger for trading logic and assumptions before you connect real capital.

Backtest Pipeline
The core loop
A backtester replays historical market data as if your application were running in the past.
Historical bars/ticks
        ↓
Strategy signal
        ↓
Execution simulation
        ↓
Portfolio update
        ↓
Metrics + trade log
The important part is time order. Your strategy must only see data that would have been available at that moment.
What we simulate today
We will keep the scope focused:
- Historical close prices
- A simple moving-average crossover strategy from the earlier lesson
- Buy/sell execution simulation
- Basic performance statistics
We will not deeply cover position sizing limits, capital-at-risk rules, or account security yet. Those belong to the next lesson: Risk Management and Security.

Minimal Backtester
A small event-style simulation
Below is a standalone C++ example that replays close prices, calculates short and long SMAs using only prior data, executes trades, and prints a final report.
Notice the key anti-cheat rule:
At index
i, the strategy computes averages from prices beforei, then executes at pricei.
That prevents the strategy from using the current bar's closing price to decide a trade at that same close.
```cpp
#include <iostream>
#include <vector>
#include <iomanip>
#include <string>

struct Trade {
    int index;
    std::string side;
    double price;
    int quantity;
};

double average(const std::vector<double>& prices, int begin, int end) {
    double sum = 0.0;
    for (int i = begin; i < end; ++i) sum += prices[i];
    return sum / (end - begin);
}

int main() {
    std::vector<double> close = {
        100, 101, 102, 103, 104, 103, 102, 101,
        103, 105, 107, 109, 108, 110, 112, 111,
        113, 115, 114, 116
    };

    const int fastN = 3;
    const int slowN = 5;
    const double feePerTrade = 1.00;

    double cash = 10000.0;
    int shares = 0;
    bool inPosition = false;
    std::vector<Trade> trades;

    for (int i = slowN; i < static_cast<int>(close.size()); ++i) {
        // Use only completed historical data: [i - N, i)
        double fast = average(close, i - fastN, i);
        double slow = average(close, i - slowN, i);
        double price = close[i];

        if (!inPosition && fast > slow) {
            int quantity = static_cast<int>((cash - feePerTrade) / price);
            if (quantity > 0) {
                cash -= quantity * price + feePerTrade;
                shares += quantity;
                inPosition = true;
                trades.push_back({i, "BUY", price, quantity});
            }
        } else if (inPosition && fast < slow) {
            cash += shares * price - feePerTrade;
            trades.push_back({i, "SELL", price, shares});
            shares = 0;
            inPosition = false;
        }
    }

    double finalEquity = cash + shares * close.back();

    std::cout << std::fixed << std::setprecision(2);
    std::cout << "Trades:\n";
    for (const auto& t : trades) {
        std::cout << "  bar=" << t.index
                  << " side=" << t.side
                  << " price=" << t.price
                  << " qty=" << t.quantity << "\n";
    }

    std::cout << "\nFinal cash: " << cash << "\n";
    std::cout << "Final shares: " << shares << "\n";
    std::cout << "Final equity: " << finalEquity << "\n";
    std::cout << "Total return: " << ((finalEquity / 10000.0) - 1.0) * 100.0 << "%\n";

    return 0;
}
```
Avoiding Backtest Cheating
A strategy calculates today's closing price, decides to buy, and assumes the buy also happened at that same closing price.
What is the main issue?
Measure The Strategy
Profit is not enough
A strategy can make money and still be unattractive if it suffers deep drawdowns or unstable returns.
Common backtest metrics include:
- Total return: final equity compared with starting equity
- Maximum drawdown: worst peak-to-trough equity decline
- Sharpe ratio: return consistency relative to volatility
- Trade count: too many trades can mean costs dominate
In a real trading system, these metrics become part of your decision loop: keep, adjust, or reject the strategy.
```cpp
#include <iostream>
#include <vector>
#include <cmath>
#include <iomanip>
#include <algorithm>

int main() {
    // Example equity curve produced by a backtest.
    std::vector<double> equity = {
        10000, 10080, 10040, 10120, 10250,
        10100, 10300, 10420, 10350, 10500
    };

    std::vector<double> returns;
    for (size_t i = 1; i < equity.size(); ++i) {
        returns.push_back((equity[i] / equity[i - 1]) - 1.0);
    }

    double totalReturn = (equity.back() / equity.front()) - 1.0;

    double peak = equity.front();
    double maxDrawdown = 0.0;
    for (double value : equity) {
        peak = std::max(peak, value);
        double drawdown = (peak - value) / peak;
        maxDrawdown = std::max(maxDrawdown, drawdown);
    }

    double mean = 0.0;
    for (double r : returns) mean += r;
    mean /= returns.size();

    double variance = 0.0;
    for (double r : returns) variance += (r - mean) * (r - mean);
    variance /= returns.size();

    double volatility = std::sqrt(variance);
    double sharpe = volatility == 0.0 ? 0.0 : (mean / volatility) * std::sqrt(252.0);

    std::cout << std::fixed << std::setprecision(4);
    std::cout << "Total return: " << totalReturn * 100.0 << "%\n";
    std::cout << "Max drawdown: " << maxDrawdown * 100.0 << "%\n";
    std::cout << "Sharpe ratio estimate: " << sharpe << "\n";

    return 0;
}
```
One Good Metric
True or false:
If a backtest has a positive total return, the strategy is automatically ready for live trading.
Costs And Slippage
The market is not frictionless
A beginner backtest often assumes:
- Every order fills instantly
- The fill happens exactly at the displayed price
- Brokerage and exchange costs are zero
- Large orders do not move the market
Those assumptions can make weak strategies look strong.
Add realism gradually
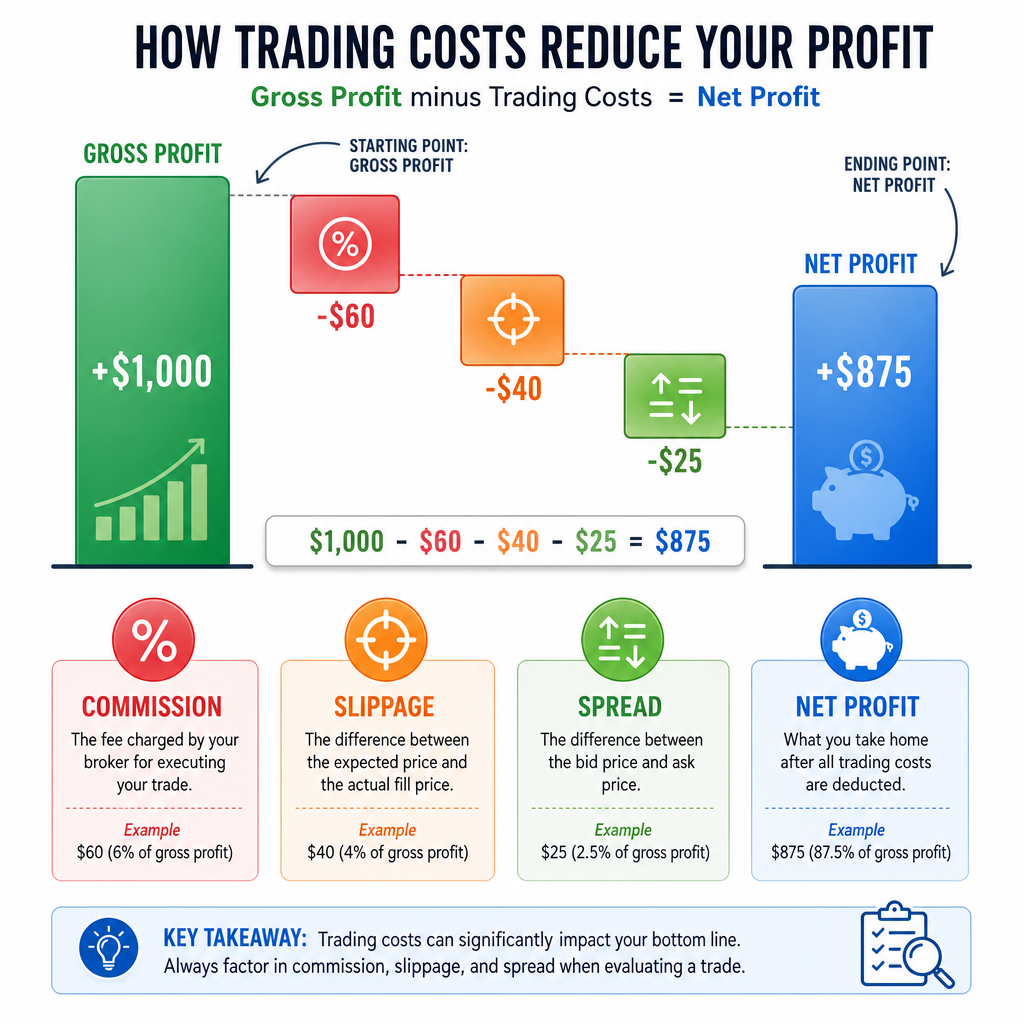
A simple model can include:
buyFill  = signalPrice + slippage
sellFill = signalPrice - slippage
netPnL   = grossPnL - commissions - fees
For fast C++ systems, this matters because a high-frequency strategy may produce many small trades. If each trade has a tiny expected edge, fees and slippage can completely erase it.
Fill The Metric
Fill in the blank:
The worst peak-to-trough decline in an equity curve is called maximum ________.
Out Of Sample
Do not optimize on the answer key
After the previous lesson, you know how tempting it is to tune parameters for speed and performance. In strategy analysis, there is another danger: tuning parameters until the backtest looks perfect.
That is called overfitting.
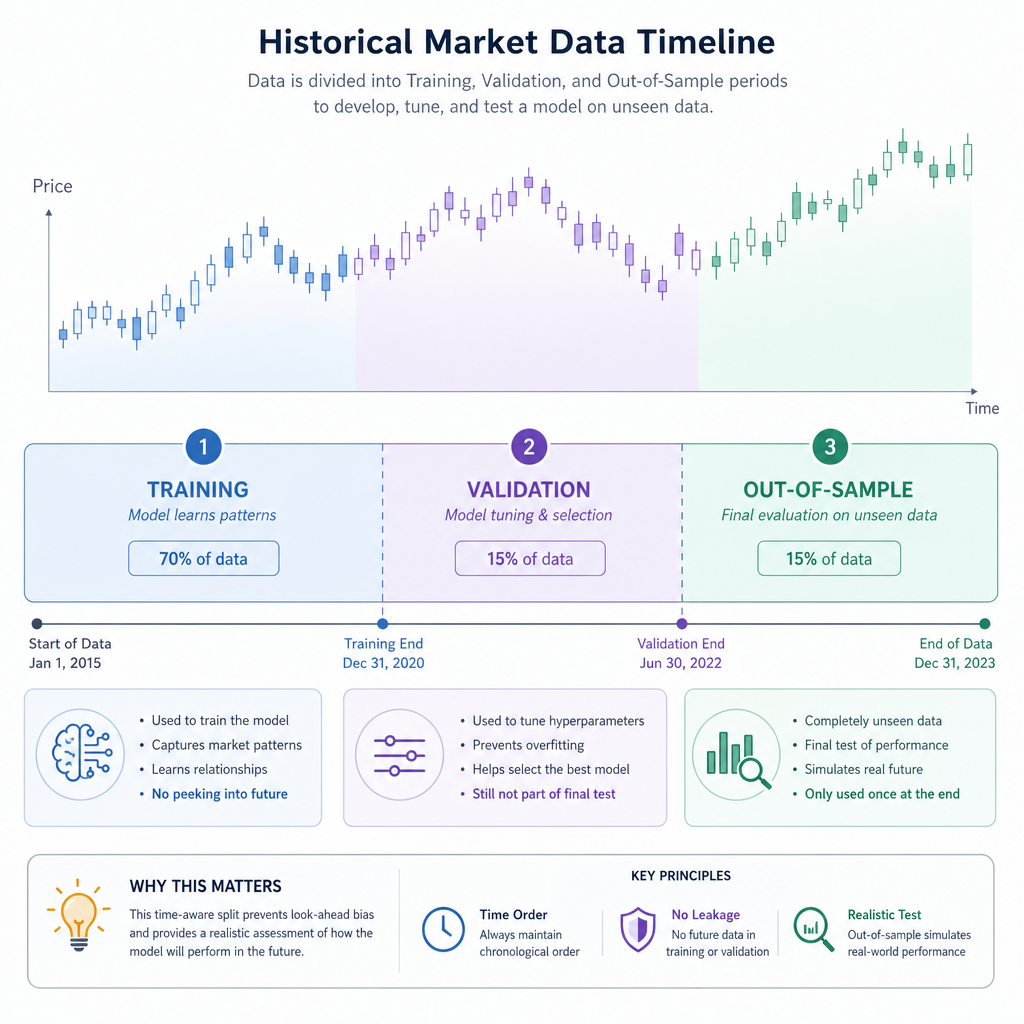
A simple defense is splitting historical data:
Training / development period  → choose strategy rules
Validation period              → compare parameter choices
Out-of-sample period           → final reality check
If a strategy only works on the exact dates used for tuning, it may not have a real edge. Strong strategies usually behave reasonably across multiple market conditions, not just one hand-picked window.
Analysis Checklist
Before trusting a backtest
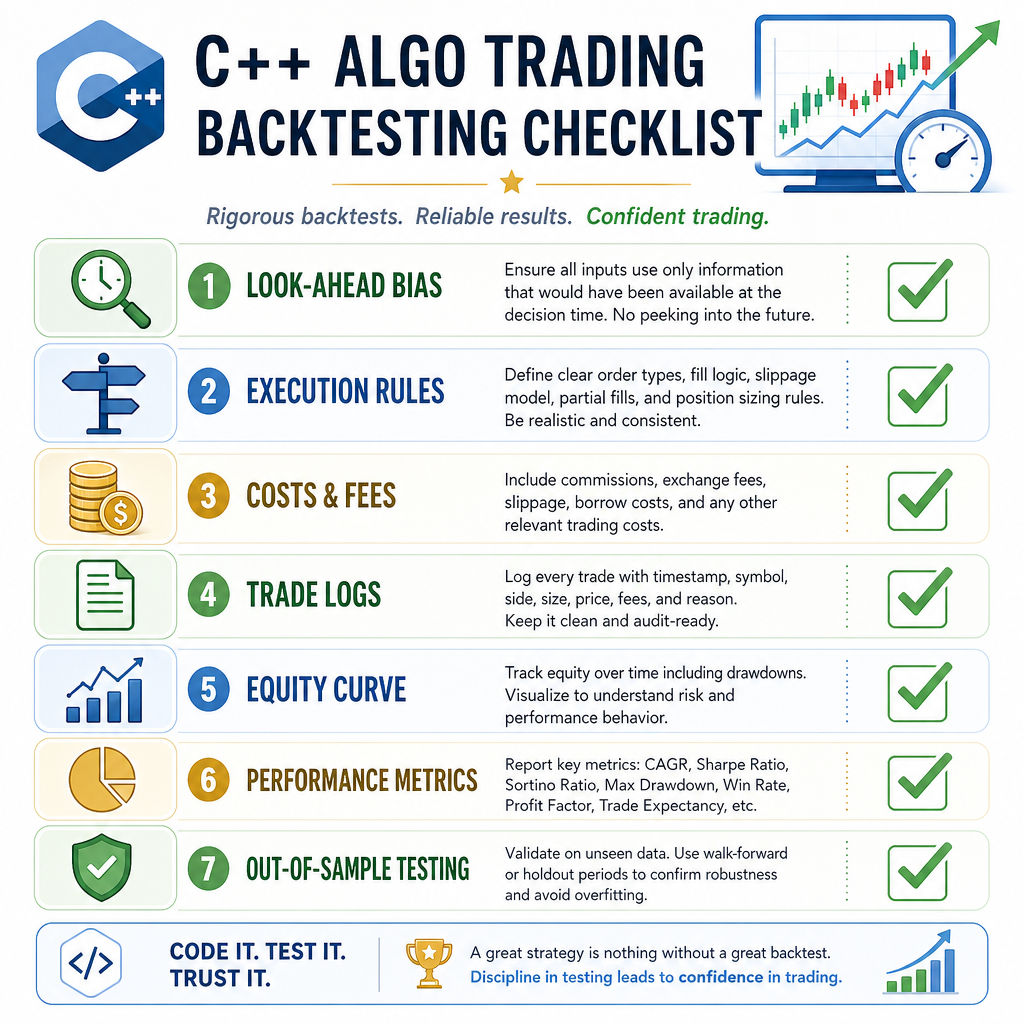
Use this checklist when analyzing a strategy:
- No look-ahead bias: decisions use only available historical data
- Clear execution rule: define when and at what simulated price orders fill
- Costs included: commissions, fees, spread, and slippage assumptions
- Trade log inspected: verify buys and sells match your intent
- Equity curve reviewed: look for unstable jumps or long painful declines
- Multiple metrics checked: return, drawdown, Sharpe, trade count
- Out-of-sample tested: avoid tuning only to the past
Backtesting is where your C++ trading application becomes more than fast code. It becomes a system you can question, measure, and improve.
Next, we will add stronger guardrails around capital, operational safety, and security.