Backtesting and Strategy Optimization
Read at your own pace. Code execution, quizzes, progress tracking, and the AI tutor are available in the interactive view with JavaScript enabled.
From Risk To Proof
Why this lesson matters
Now that you have built signals in Developing Trading Algorithms and placed them behind risk gates in Implementing Risk Management Techniques, the next question is simple:
Would this idea have survived real market history?
Backtesting answers that by replaying historical market data through your strategy as if time were moving forward.
In this lesson, you will learn how to:
- Run a realistic C++ backtest loop
- Track trades, equity, and drawdowns
- Add costs and avoid lookahead bias
- Optimize parameters without fooling yourself
This is the final validation step before the next lesson, where you will prepare the application for deployment.

Backtest Mental Model
Replay the market, do not predict it
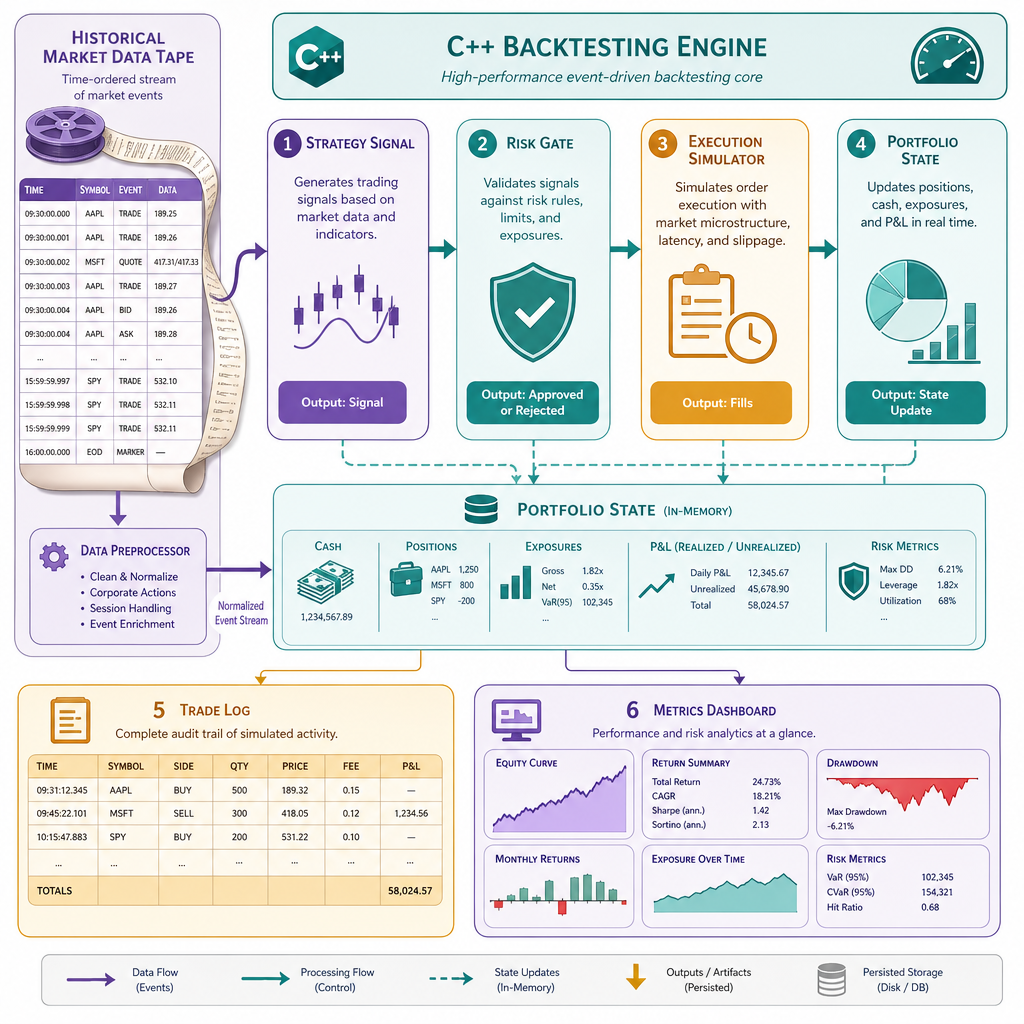
A backtest is an event loop over historical bars, ticks, or order book updates.
At each step, your program should only know what would have been known at that moment.
Historical Data
      |
      v
Strategy Signal  ->  Risk Gate  ->  Simulated Execution
      |                              |
      v                              v
Trade Log  <------------------- Portfolio State
      |
      v
Metrics: return, drawdown, win rate, Sharpe
The important shift is this:
- In strategy development, you ask: When should I buy or sell?
- In backtesting, you ask: What would have happened after realistic execution?
That means fills, transaction costs, slippage, position changes, and equity history all matter.
Backtest Purpose Check
In a backtest, what is the most important rule for handling historical data?
C++ Backtest Loop
A minimal executable backtester
Below is a compact C++ example that reuses the strategy/risk mental model from earlier lessons.
The backtest:
- Replays prices one bar at a time
- Generates a simple momentum signal
- Buys or sells one share
- Applies a small fee
- Prints trades and final equity
This is intentionally small, but the structure is the same shape you would grow into a larger trading engine.
```cpp
#include <iostream>
#include <vector>
#include <iomanip>

struct Bar {
    int time;
    double close;
};

class MomentumStrategy {
public:
    explicit MomentumStrategy(int lookback) : lookback_(lookback) {}

    int signal(const std::vector<Bar>& bars, std::size_t i) const {
        if (i < static_cast<std::size_t>(lookback_)) return 0;

        double past = bars[i - lookback_].close;
        double now = bars[i].close;

        if (now > past * 1.01) return 1;   // buy
        if (now < past * 0.99) return -1;  // sell
        return 0;
    }

private:
    int lookback_;
};

int main() {
    std::vector<Bar> bars = {
        {1, 100.0}, {2, 101.2}, {3, 102.5}, {4, 101.0},
        {5, 103.8}, {6, 105.0}, {7, 104.2}, {8, 102.0},
        {9, 100.5}, {10, 99.0}
    };

    MomentumStrategy strategy(2);

    double cash = 10000.0;
    int shares = 0;
    const double feePerTrade = 1.0;

    for (std::size_t i = 0; i < bars.size(); ++i) {
        int s = strategy.signal(bars, i);
        double price = bars[i].close;

        if (s == 1 && shares == 0) {
            cash -= price + feePerTrade;
            shares = 1;
            std::cout << "BUY  at t=" << bars[i].time << " price=" << price << '\n';
        } else if (s == -1 && shares == 1) {
            cash += price - feePerTrade;
            shares = 0;
            std::cout << "SELL at t=" << bars[i].time << " price=" << price << '\n';
        }
    }

    double finalEquity = cash + shares * bars.back().close;

    std::cout << std::fixed << std::setprecision(2);
    std::cout << "Final cash:   " << cash << '\n';
    std::cout << "Final shares: " << shares << '\n';
    std::cout << "Final equity: " << finalEquity << '\n';

    return 0;
}
```
Lookahead Bias
True or false: If a strategy calculates today's signal using tomorrow's close, the backtest may look profitable even though it is not tradable in real time.
Measure The Run
A backtest is not only profit
Profit is useful, but incomplete. A strategy that makes 5% with tiny drawdown may be better than one that makes 12% while nearly blowing up.
Common metrics include:
- Total return: overall portfolio growth
- Max drawdown: worst peak-to-trough equity fall
- Sharpe-like ratio: return consistency relative to volatility
- Trade count: too few trades may mean weak evidence
The code below computes basic return, drawdown, and a simplified Sharpe-like value from an equity curve.
```cpp
#include <iostream>
#include <vector>
#include <cmath>
#include <iomanip>
#include <algorithm>

int main() {
    std::vector<double> equity = {
        10000, 10080, 10040, 10150, 10220,
        10100, 10300, 10240, 10450, 10420
    };

    double totalReturn = (equity.back() / equity.front()) - 1.0;

    double peak = equity.front();
    double maxDrawdown = 0.0;

    for (double value : equity) {
        peak = std::max(peak, value);
        double drawdown = (peak - value) / peak;
        maxDrawdown = std::max(maxDrawdown, drawdown);
    }

    std::vector<double> returns;
    for (std::size_t i = 1; i < equity.size(); ++i) {
        returns.push_back((equity[i] / equity[i - 1]) - 1.0);
    }

    double mean = 0.0;
    for (double r : returns) mean += r;
    mean /= returns.size();

    double variance = 0.0;
    for (double r : returns) variance += (r - mean) * (r - mean);
    variance /= returns.size();

    double volatility = std::sqrt(variance);
    double sharpeLike = volatility > 0.0 ? mean / volatility : 0.0;

    std::cout << std::fixed << std::setprecision(4);
    std::cout << "Total return: " << totalReturn * 100 << "%\n";
    std::cout << "Max drawdown: " << maxDrawdown * 100 << "%\n";
    std::cout << "Sharpe-like:  " << sharpeLike << "\n";

    return 0;
}
```
Metric Vocabulary
The worst percentage fall from a previous equity peak to a later low is called max ________.
Optimization Without Illusion
Optimization means searching carefully
Strategy optimization tests different parameter values, such as moving average windows, thresholds, or stop distances.
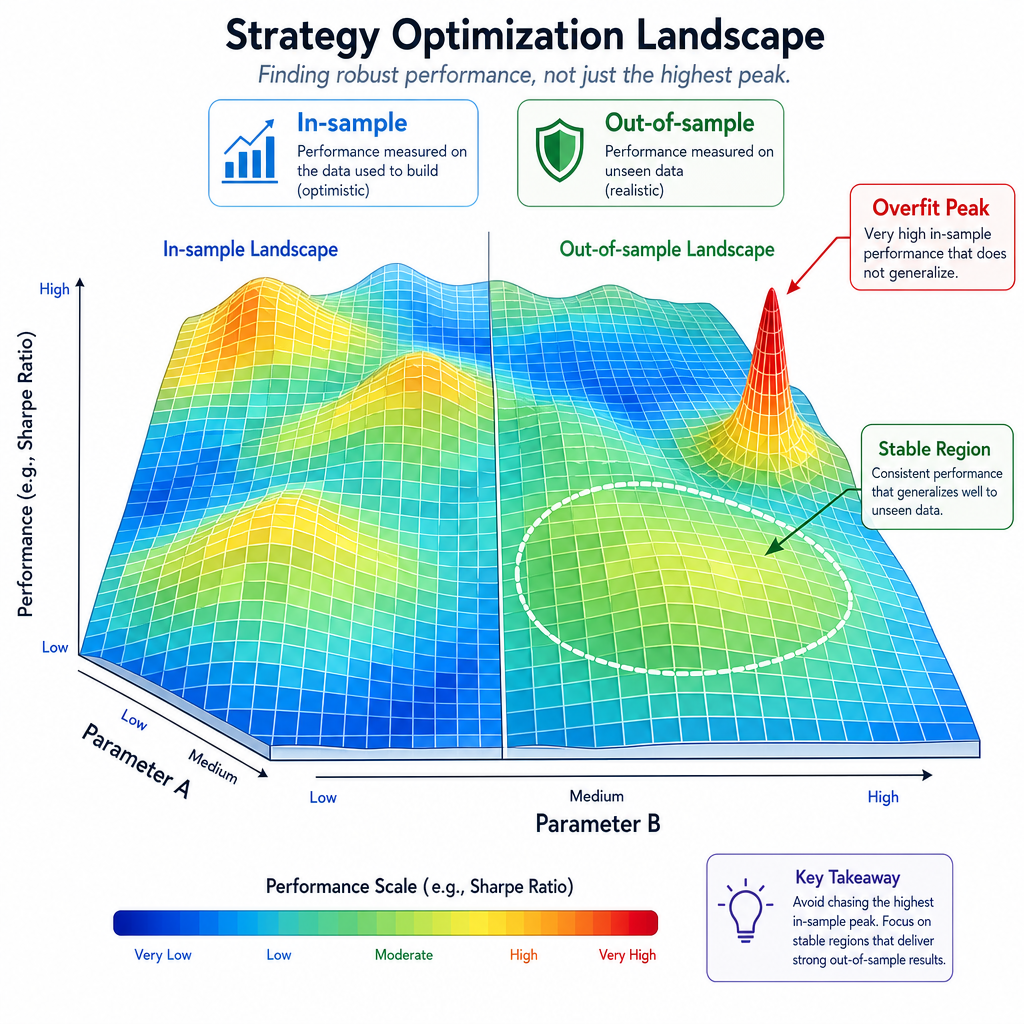
But there is a trap: if you test enough combinations, one may look excellent by luck.
A healthier workflow is:
- Pick a small, reasonable parameter range
- Test on an in-sample period
- Confirm on an out-of-sample period
- Prefer stable regions over one perfect value
You are not looking for the prettiest historical chart. You are looking for a rule that remains reasonable when the data changes.
Grid Search Example
Testing parameter combinations
A simple first optimizer is a grid search: loop through parameter choices, run the backtest, and keep the best result.
This example compares fast and slow moving average windows. Notice the guard condition: the fast window must be smaller than the slow window.
In production-level research, you would also separate in-sample and out-of-sample data, include costs, and inspect drawdown, not just final equity.
```cpp
#include <iostream>
#include <vector>
#include <numeric>
#include <iomanip>

std::vector<double> prices = {
    100, 101, 102, 103, 102, 104, 106, 105,
    107, 109, 108, 110, 111, 109, 112, 114
};

double sma(int endIndex, int window) {
    double sum = 0.0;
    for (int i = endIndex - window + 1; i <= endIndex; ++i) {
        sum += prices[i];
    }
    return sum / window;
}

double runBacktest(int fast, int slow) {
    double cash = 10000.0;
    int shares = 0;

    for (int i = slow - 1; i < static_cast<int>(prices.size()); ++i) {
        double fastAvg = sma(i, fast);
        double slowAvg = sma(i, slow);
        double price = prices[i];

        if (fastAvg > slowAvg && shares == 0) {
            cash -= price;
            shares = 1;
        } else if (fastAvg < slowAvg && shares == 1) {
            cash += price;
            shares = 0;
        }
    }

    return cash + shares * prices.back();
}

int main() {
    double bestEquity = 0.0;
    int bestFast = 0;
    int bestSlow = 0;

    for (int fast = 2; fast <= 4; ++fast) {
        for (int slow = 5; slow <= 8; ++slow) {
            if (fast >= slow) continue;

            double equity = runBacktest(fast, slow);
            std::cout << "fast=" << fast
                      << " slow=" << slow
                      << " equity=" << equity << '\n';

            if (equity > bestEquity) {
                bestEquity = equity;
                bestFast = fast;
                bestSlow = slow;
            }
        }
    }

    std::cout << std::fixed << std::setprecision(2);
    std::cout << "Best: fast=" << bestFast
              << " slow=" << bestSlow
              << " equity=" << bestEquity << '\n';

    return 0;
}
```
Optimization Trap
You test 2,000 parameter combinations and choose the one with the highest historical return. What is the biggest danger?
Backtest Checklist
What you should carry forward
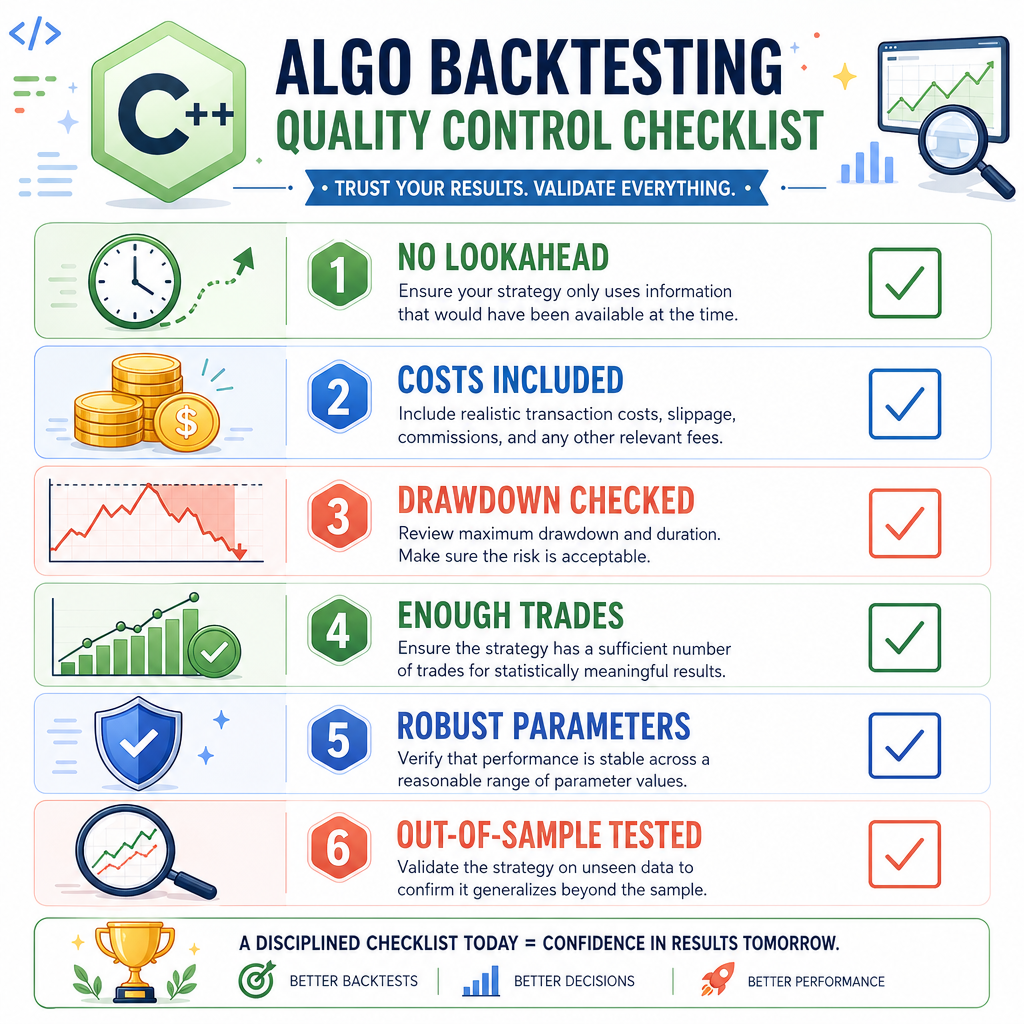
Before trusting a strategy, check:
- No lookahead bias: decisions use only available past/current data
- Realistic execution: include fees, slippage, and fill assumptions
- Risk-aware metrics: inspect drawdown, not only return
- Enough evidence: avoid conclusions from tiny trade samples
- Robust parameters: prefer stable zones over one lucky setting
- Out-of-sample validation: confirm beyond the optimization period
Backtesting is not a guarantee of future profit. It is a filter that helps you reject weak ideas before risking real capital.
Next, you will move from validated research toward packaging and running your trading application more like a real system.