Building a Real-Time Algorithmic Trading Framework in R
Read at your own pace. Code execution, quizzes, progress tracking, and the AI tutor are available in the interactive view with JavaScript enabled.
From Bars To Framework
Why this lesson matters
In Accessing and Streaming OHLC Data from APIs and Web-Sockets in R, you built the ingestion side: REST pulls, WebSocket streams, simulated feeds, and quality checks.
In Resampling and Aggregating Time-Frame Data in R, you learned how second-level updates become 30-minute and 60-minute bars, then how multiple timeframes can be aligned.
Now we connect those pieces into a real-time trading framework:
- one event comes in
- state is updated
- timeframes are refreshed
- indicators are recalculated
- one aligned feature row is produced
- downstream logic can read it safely
Think of this lesson as building the engine room before adding the machine learning driver in the next lesson.

Framework Mental Model
The real-time loop
A dynamic trading system is not just a script that calculates moving averages. It is a stateful loop.
incoming event
     ↓
validate / normalize
     ↓
append to raw state
     ↓
update 30m and 60m bars
     ↓
recalculate indicators
     ↓
emit latest aligned row
     ↓
log / display / strategy reads
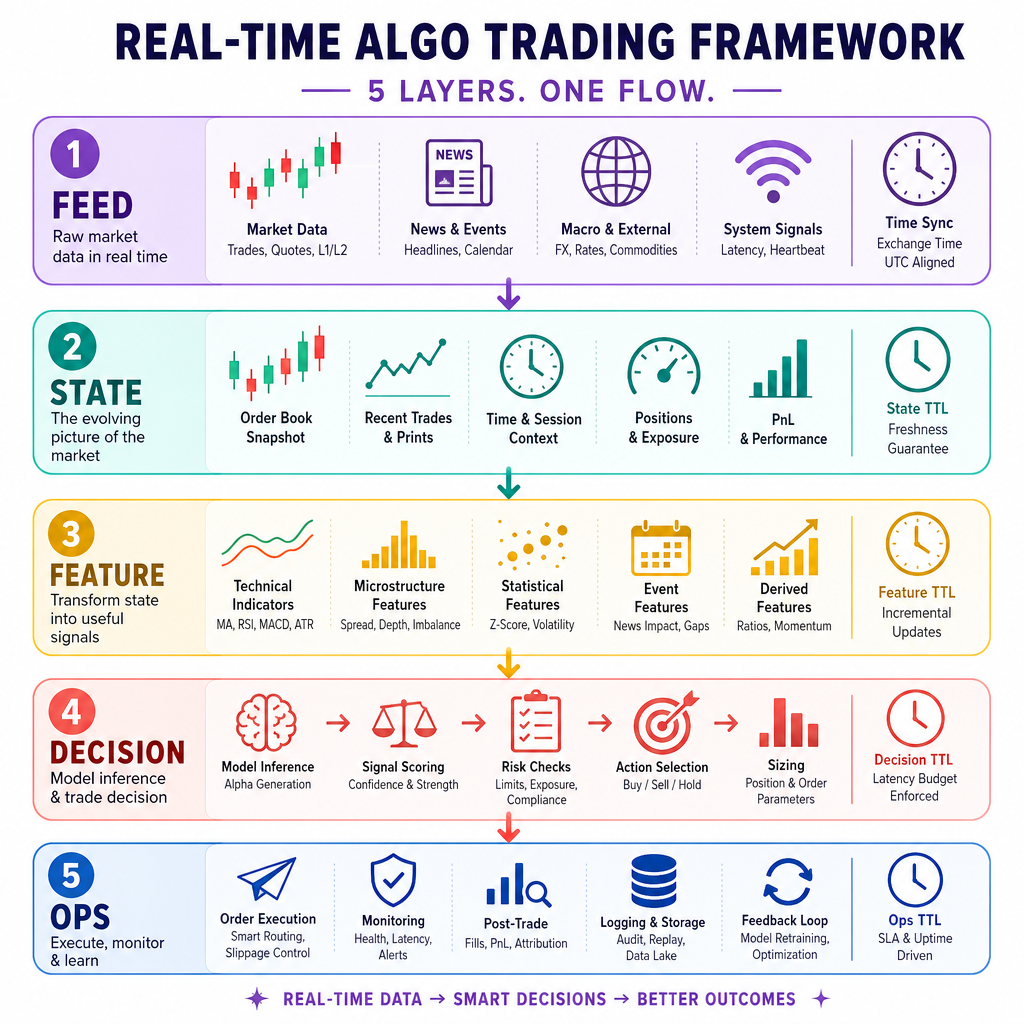
The key design idea: never let every part of your system talk directly to every other part.
Instead, separate responsibilities:
- Feed layer: receives ticks, trades, quotes, or second bars
- State layer: stores recent raw and aggregated data
- Feature layer: creates aligned 30m/60m columns
- Decision layer: consumes the latest row
- Ops layer: logs errors, latency, and data gaps
This keeps your trading code testable instead of becoming one giant tangled loop.
State Store Skeleton
Keep state explicit
In live trading, you do not recompute everything from scratch after every event if you can avoid it. You keep a controlled state object.
Below is a small Python version of the same framework idea you would also use in R with data.table, xts, or R6.
The important part is not the language syntax. It is the contract:
- raw second-level rows live in one place
- 30m bars live in one place
- 60m bars live in one place
- the latest merged feature row is created from those states
```python
import pandas as pd
from dataclasses import dataclass, field

@dataclass
class TradingState:
    raw_seconds: pd.DataFrame = field(default_factory=lambda: pd.DataFrame(
        columns=["timestamp", "open", "high", "low", "close", "volume"]
    ))
    bars_30m: pd.DataFrame = field(default_factory=pd.DataFrame)
    bars_60m: pd.DataFrame = field(default_factory=pd.DataFrame)
    latest_features: pd.DataFrame = field(default_factory=pd.DataFrame)

state = TradingState()

print("Raw columns:", list(state.raw_seconds.columns))
print("30m bars empty?", state.bars_30m.empty)
print("60m bars empty?", state.bars_60m.empty)
print("Feature table empty?", state.latest_features.empty)
```
Core Responsibility
Which framework layer should own the job of storing recent raw seconds data and current 30m/60m bars?
Update One Event
One event should update the system
In a live environment, you want a function that accepts one new row and returns updated state.
For teaching clarity, this example recomputes 30m and 60m bars each time. In production, you may optimize by updating only the active bar.
Notice the framework shape:
- receive one event
- append it to raw state
- resample into multiple timeframes
- calculate moving averages
- print the latest aligned values
```python
import pandas as pd
from dataclasses import dataclass, field

@dataclass
class TradingState:
    raw_seconds: pd.DataFrame = field(default_factory=lambda: pd.DataFrame(
        columns=["timestamp", "open", "high", "low", "close", "volume"]
    ))
    bars_30m: pd.DataFrame = field(default_factory=pd.DataFrame)
    bars_60m: pd.DataFrame = field(default_factory=pd.DataFrame)


def build_bars(df, rule):
    x = df.copy()
    x["timestamp"] = pd.to_datetime(x["timestamp"])
    x = x.set_index("timestamp").sort_index()
    bars = x.resample(rule).agg({
        "open": "first",
        "high": "max",
        "low": "min",
        "close": "last",
        "volume": "sum"
    }).dropna()
    bars["ma_3"] = bars["close"].rolling(3).mean()
    return bars


def on_event(state, event):
    state.raw_seconds = pd.concat(
        [state.raw_seconds, pd.DataFrame([event])],
        ignore_index=True
    )
    state.bars_30m = build_bars(state.raw_seconds, "30min")
    state.bars_60m = build_bars(state.raw_seconds, "60min")
    return state

state = TradingState()
base = pd.Timestamp("2025-01-02 09:30:00")

for i in range(0, 181, 30):
    price = 100 + i * 0.05
    event = {
        "timestamp": base + pd.Timedelta(minutes=i),
        "open": price,
        "high": price + 0.4,
        "low": price - 0.3,
        "close": price + 0.1,
        "volume": 1000 + i
    }
    state = on_event(state, event)

print("30m bars:")
print(state.bars_30m[["close", "ma_3"]].tail())
print("\n60m bars:")
print(state.bars_60m[["close", "ma_3"]].tail())
```
Recompute Everything
True or false: In production, a real-time framework should usually recompute every historical bar from scratch after every incoming second-level update, even when only the newest bar changed.
Emit Feature Row
The feature row is your handoff point
Your goal is to see values like 30-minute and 60-minute moving averages on the same line.
That line becomes the handoff between market data engineering and strategy logic.
A practical feature row might contain:
- latest 30m close
- latest 30m moving average
- latest 60m close
- latest 60m moving average
- timestamp alignment
- symbol
Below, we create a small aligned feature table. This does not train a model yet; it prepares the clean input that the next lesson can feed into prediction logic.
```python
import pandas as pd

# Example bars that already came from the resampling layer
bars_30m = pd.DataFrame({
    "timestamp": pd.to_datetime([
        "2025-01-02 10:00", "2025-01-02 10:30", "2025-01-02 11:00", "2025-01-02 11:30"
    ]),
    "close_30m": [101.2, 102.0, 101.7, 103.1]
})
bars_30m["ma_30m_3"] = bars_30m["close_30m"].rolling(3).mean()

bars_60m = pd.DataFrame({
    "timestamp": pd.to_datetime([
        "2025-01-02 10:00", "2025-01-02 11:00"
    ]),
    "close_60m": [101.8, 102.6]
})
bars_60m["ma_60m_2"] = bars_60m["close_60m"].rolling(2).mean()

# Align each 30m row with the most recent known 60m row
features = pd.merge_asof(
    bars_30m.sort_values("timestamp"),
    bars_60m.sort_values("timestamp"),
    on="timestamp",
    direction="backward"
)
features["symbol"] = "DEMO"

print(features.tail(4))
print("\nLatest feature row:")
print(features.tail(1).to_dict(orient="records")[0])
```
Alignment Function
Fill in the missing function name: in pandas, pd.__________ can align each 30-minute row with the most recent known 60-minute row when timestamps do not match exactly.
Runtime Guardrails
What makes it usable live?
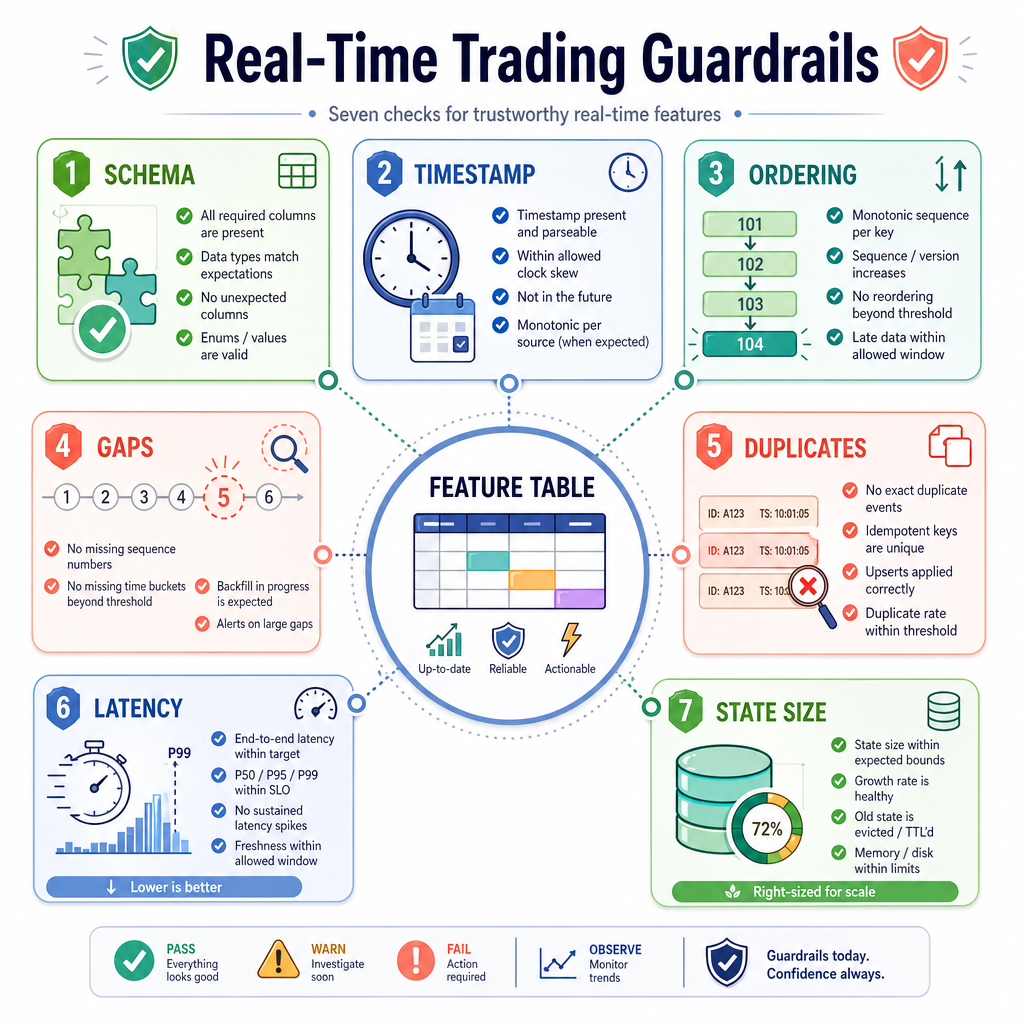
A real-time framework needs more than calculations. It needs guardrails.
Minimum production checks
- Schema check: required columns exist
- Timestamp check: no impossible future/past rows
- Ordering check: events are sorted or intentionally handled out of order
- Gap check: missing seconds/minutes are detected
- Duplicate check: repeated rows are ignored or corrected
- Latency check: event time vs processing time is monitored
- State size check: old raw rows are trimmed when no longer needed
A useful rule
If your strategy reads from latest_features, it should not care whether the input came from REST, WebSocket, replay, or simulation.
That is how you make the system testable before risking real capital.
Framework Boundary
Why is latest_features a useful boundary in a real-time trading framework?