Data Warehousing
Read at your own pace. Code execution, quizzes, progress tracking, and the AI tutor are available in the interactive view with JavaScript enabled.
Why Warehouses Matter
From tiny pipeline to trusted analytics
In Introduction to Data Engineering, you built the mental model: data engineers create reliable paths from raw data to usable data products.
Now we zoom in on one of the most important destinations on that path: the data warehouse.
A warehouse is where teams answer questions like:
- How much revenue did we make last quarter?
- Which products are growing fastest by region?
- Are customer support issues increasing after a release?
- Which users are active, retained, or at risk?
The key idea: a warehouse is not just “a big database.” It is a system designed for analytical trust: consistent definitions, historical data, fast reporting, and shared business meaning.

Warehouse Mental Model
What a warehouse optimizes for
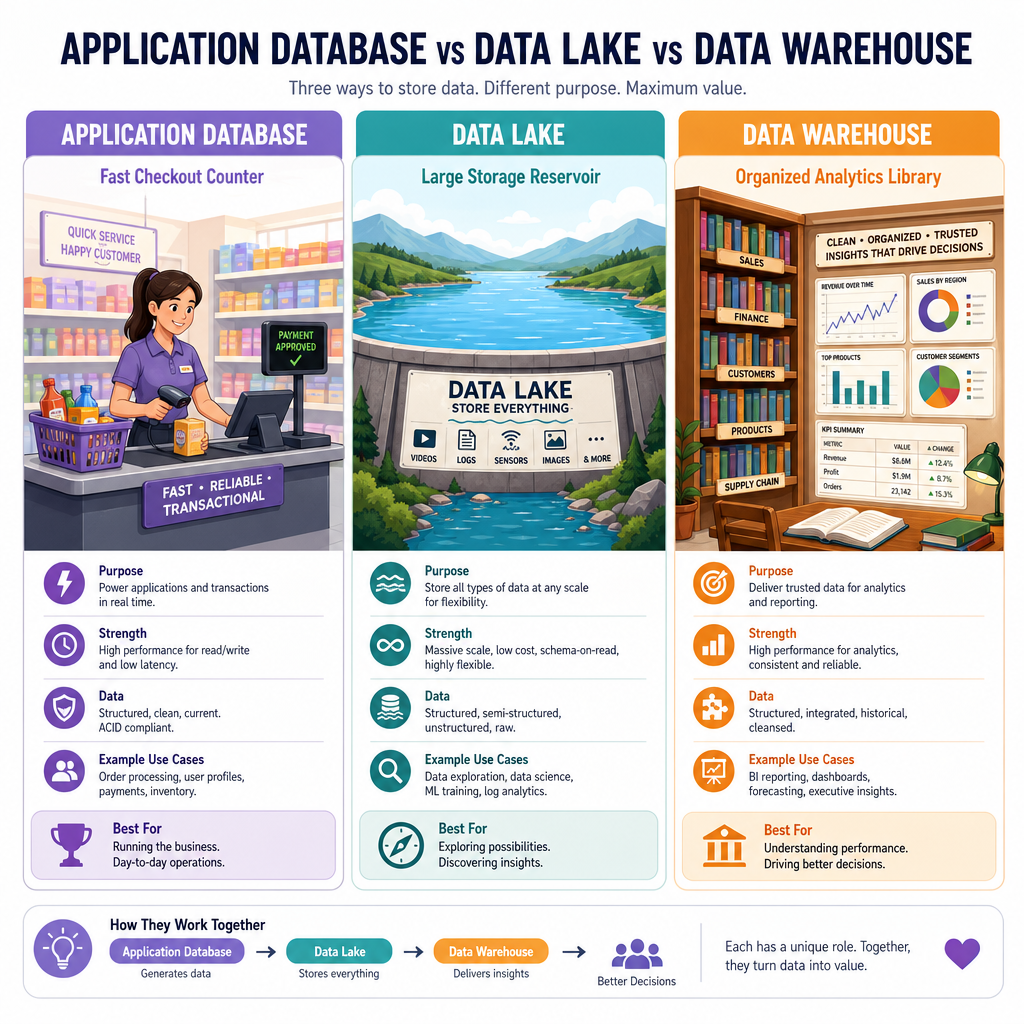
A data warehouse is typically optimized for reads, aggregations, history, and shared analysis.
That makes it different from an application database, which is usually optimized for transactional correctness and fast small writes.
System Main job Typical access pattern Application database Run the product Insert/update one user, order, payment, etc. Data lake Store raw or semi-processed files Large-scale storage and flexible processing Data warehouse Answer analytical questions Scan, join, aggregate, compare over timeA warehouse often becomes the organization’s source of analytical truth. That does not mean it is perfect by default. It means data engineers must design it so that definitions, history, and quality are explicit.
Facts And Dimensions
The core warehouse shape
Many warehouses use dimensional modeling because it makes analytical questions easier to express and faster to answer.
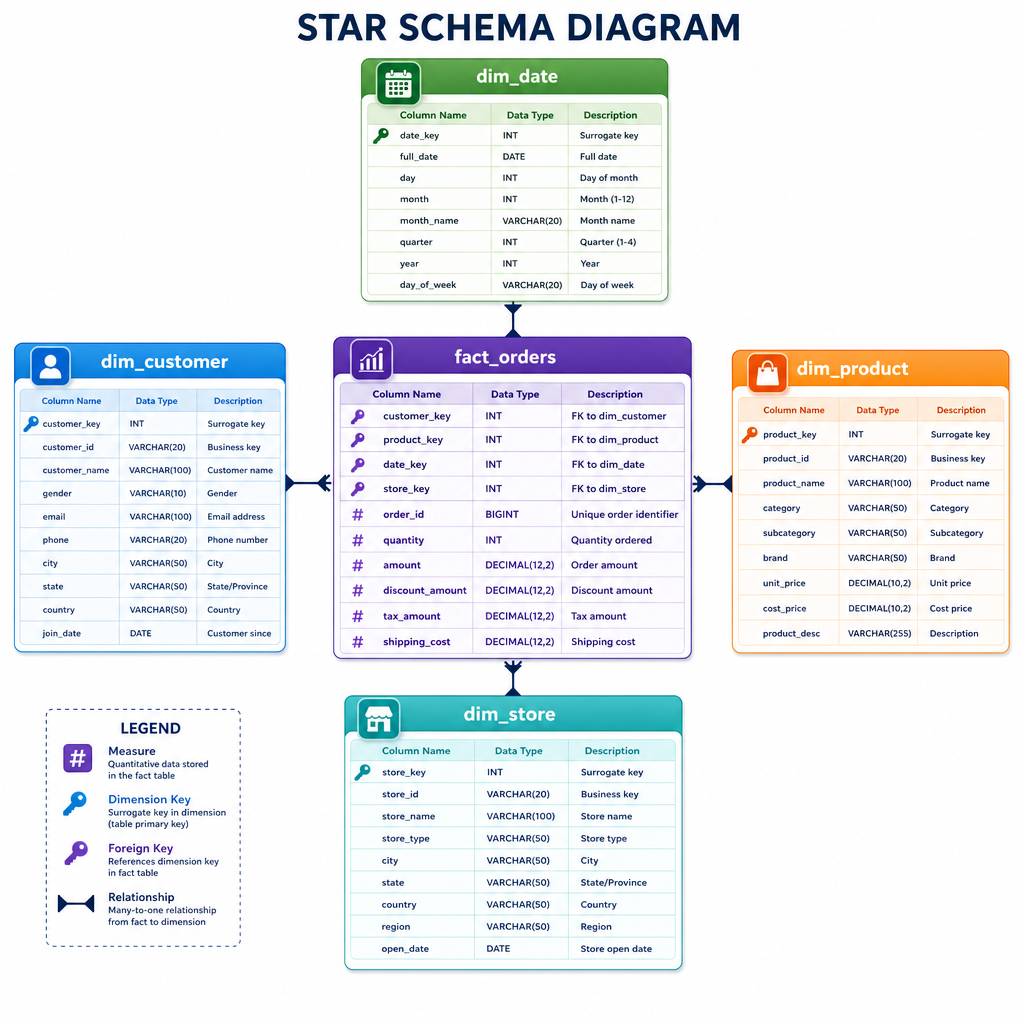
The most common pattern is the star schema:
              dim_customer
                   |
dim_date ---- fact_orders ---- dim_product
                   |
              dim_store
Fact tables
A fact table stores business events or measurements:
- one row per order line
- one row per payment
- one row per page view
- one row per shipment event
Facts usually contain numeric measures like amount, quantity, or duration.
Dimension tables
A dimension table stores descriptive context:
- customer attributes
- product category
- calendar fields
- store region
The most important modeling question is: what is the grain?
The grain is the exact meaning of one row, such as “one row per order item” or “one row per customer per day.” If the grain is vague, downstream metrics become fragile.
Mini Star Schema
A tiny warehouse in Python
Here is a small, executable example of a star-schema-like model using Python’s built-in sqlite3 module.
Notice the shape:
-
fact_ordersstores events and measures -
dim_customeranddim_productadd descriptive context - the final result answers an analytical question: revenue by customer segment
We are not focusing on SQL syntax yet; the next lesson will go deeper into database querying.
```python
import sqlite3

conn = sqlite3.connect(":memory:")
cur = conn.cursor()

cur.execute("CREATE TABLE dim_customer (customer_id INTEGER PRIMARY KEY, name TEXT, segment TEXT)")
cur.execute("CREATE TABLE dim_product (product_id INTEGER PRIMARY KEY, product_name TEXT, category TEXT)")
cur.execute("CREATE TABLE fact_orders (order_id INTEGER PRIMARY KEY, customer_id INTEGER, product_id INTEGER, amount REAL)")

cur.executemany(
    "INSERT INTO dim_customer VALUES (?, ?, ?)",
    [
        (1, "Ava", "Enterprise"),
        (2, "Ben", "Startup"),
        (3, "Chen", "Enterprise")
    ]
)

cur.executemany(
    "INSERT INTO dim_product VALUES (?, ?, ?)",
    [
        (10, "Cloud Storage", "Platform"),
        (20, "Analytics Seat", "Software")
    ]
)

cur.executemany(
    "INSERT INTO fact_orders VALUES (?, ?, ?, ?)",
    [
        (1001, 1, 10, 1200.00),
        (1002, 2, 20, 300.00),
        (1003, 3, 10, 900.00),
        (1004, 1, 20, 450.00)
    ]
)

query = """
SELECT c.segment, ROUND(SUM(f.amount), 2) AS revenue
FROM fact_orders f
JOIN dim_customer c ON f.customer_id = c.customer_id
GROUP BY c.segment
ORDER BY revenue DESC
"""

for segment, revenue in cur.execute(query):
    print(f"{segment}: ${revenue:,.2f}")

conn.close()
```
Choose The Grain
You are designing a warehouse table for ecommerce order items.
The business wants to analyze revenue by product, customer, and day. Each order can contain multiple products.
Which grain is usually the best fit for the central fact table?
Modeling Tradeoffs
Warehouse design is deliberate compromise
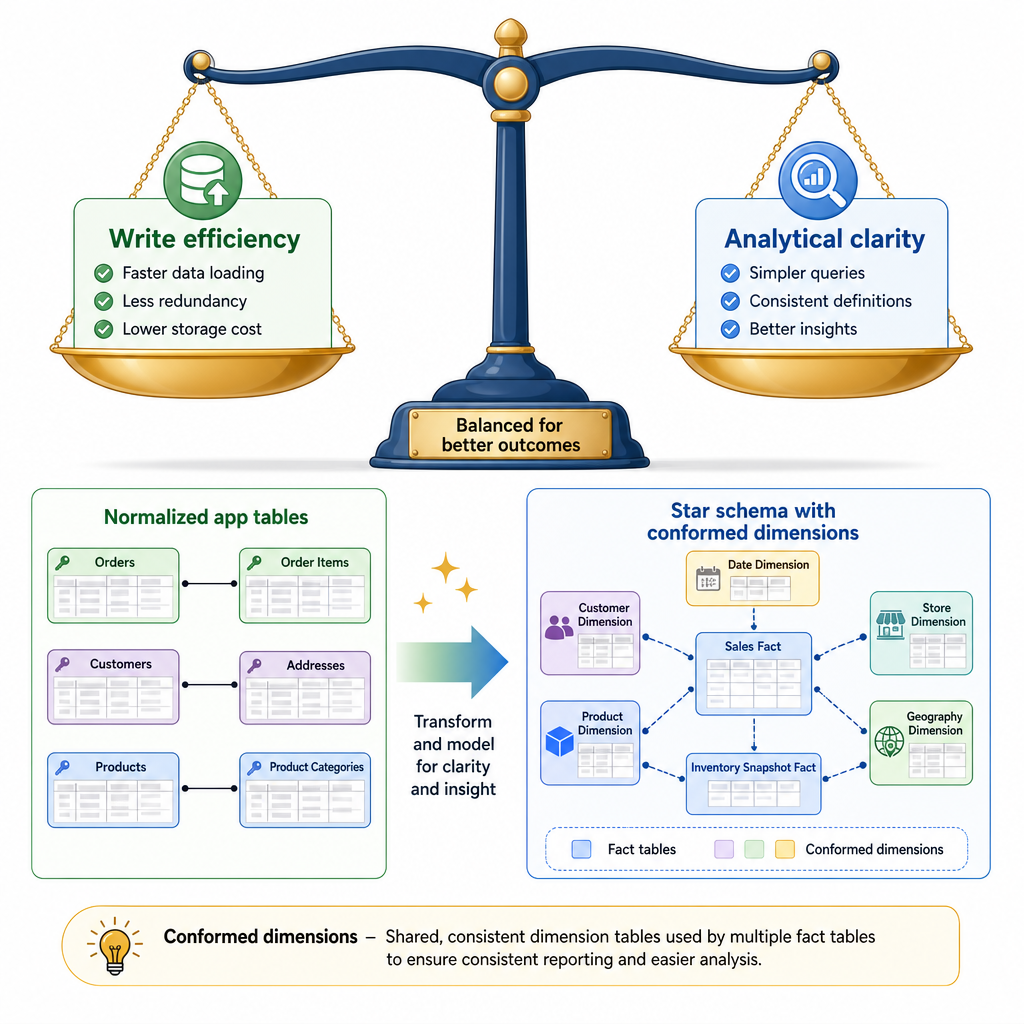
Warehouse models often look less “normalized” than application databases. That is intentional.
In transactional systems, you often normalize data to reduce duplication and protect writes. In analytical systems, you often reshape data to make common questions easier and faster.
Useful warehouse design ideas:
- Denormalization: repeating some descriptive fields can make analysis simpler.
- Surrogate keys: warehouse-generated IDs can protect analytics from messy source-system IDs.
-
Conformed dimensions: shared dimensions like
dim_date,dim_customer, ordim_producthelp teams compare metrics consistently. - Historical tracking: warehouses often preserve changes over time instead of only storing the current state.
The goal is not to model every possible future question. The goal is to create stable, understandable structures for the questions the business repeatedly asks.
Warehouse Or App DB
True or false:
A data warehouse is usually designed to optimize high-volume inserts and updates for a mobile app’s checkout flow.
Validate Warehouse Tables
Trust requires checks
A warehouse table can look clean and still be analytically dangerous.
Before teams build dashboards on a fact table, data engineers often validate assumptions such as:
- Does the table obey its declared grain?
- Are important keys present?
- Do fact rows point to known dimension rows?
- Are measures non-negative when the business expects that?
Here is a tiny Python example that checks two warehouse assumptions:
-
order_item_idshould be unique because the grain is one row per order item. - Every
product_idin the fact table should exist indim_product.
```python
fact_order_items = [
    {"order_item_id": 1, "product_id": 10, "amount": 120.0},
    {"order_item_id": 2, "product_id": 20, "amount": 75.0},
    {"order_item_id": 2, "product_id": 20, "amount": 75.0},  # duplicate grain key
    {"order_item_id": 3, "product_id": 99, "amount": 40.0},  # missing dimension row
]

dim_product = [
    {"product_id": 10, "name": "Storage"},
    {"product_id": 20, "name": "Analytics"},
]

seen_order_items = set()
duplicate_order_items = []

for row in fact_order_items:
    key = row["order_item_id"]
    if key in seen_order_items:
        duplicate_order_items.append(key)
    seen_order_items.add(key)

valid_product_ids = {row["product_id"] for row in dim_product}
missing_product_ids = sorted({
    row["product_id"]
    for row in fact_order_items
    if row["product_id"] not in valid_product_ids
})

print("Duplicate order_item_id values:", duplicate_order_items)
print("Missing product_id values:", missing_product_ids)

if duplicate_order_items or missing_product_ids:
    print("Warehouse validation failed")
else:
    print("Warehouse validation passed")
```
Fill The Term
In dimensional modeling, a central table that stores business events or numeric measurements at a declared grain is called a ____ table.
Warehousing In Practice
How warehouses fit into real systems
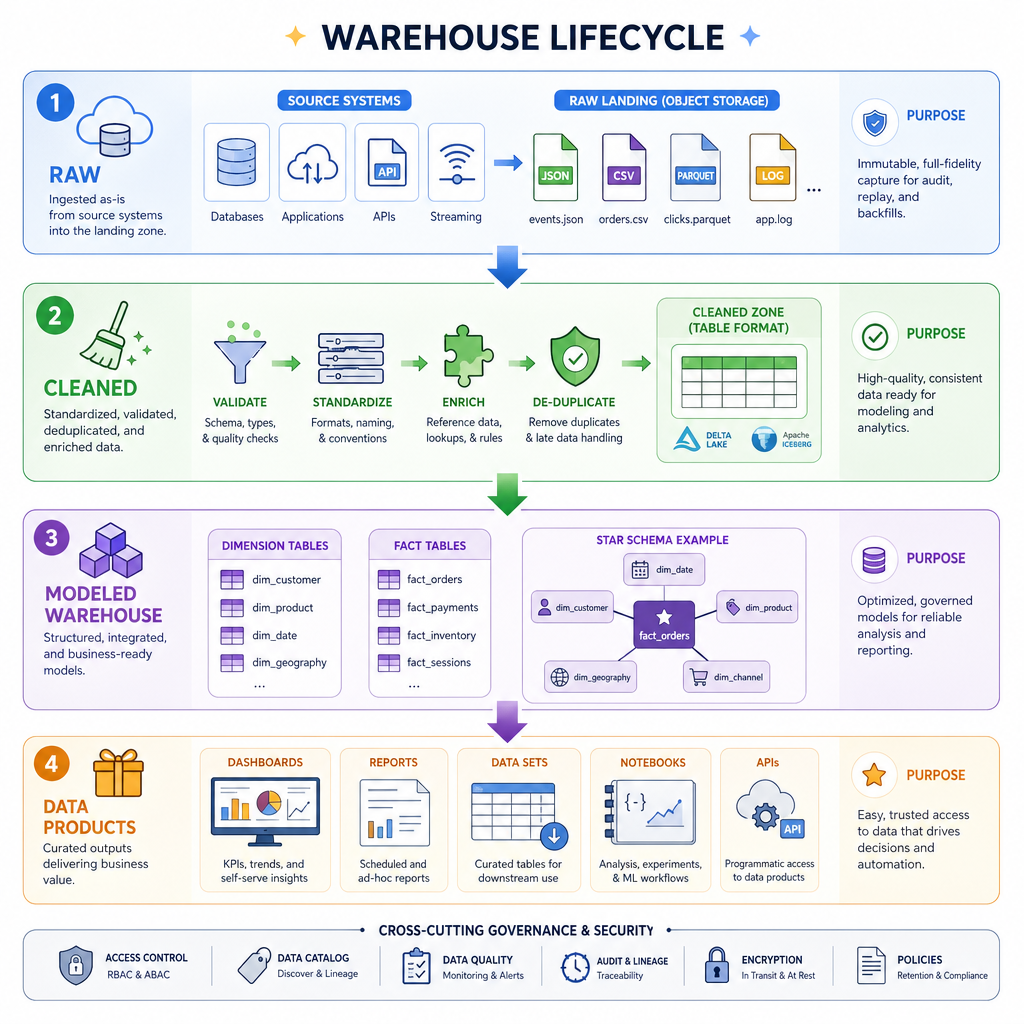
In practice, warehouse data is often organized into layers so people know how much trust and transformation each table represents.
A common pattern:
raw source copies
      ↓
cleaned and standardized tables
      ↓
modeled warehouse tables
      ↓
dashboards, reports, notebooks, data products
As a data engineer, your warehouse responsibilities often include:
- defining table grain and ownership
- choosing fact and dimension structures
- documenting business definitions
- validating data quality assumptions
- making analytical tables understandable and reusable
- balancing performance with maintainability
This gives us the storage and modeling foundation. Next, we will focus on Database Querying: how to inspect, retrieve, join, filter, and reason about data once it lives in these systems.