Fetching OHLC Data from APIs
Read at your own pace. Code execution, quizzes, progress tracking, and the AI tutor are available in the interactive view with JavaScript enabled.
Why APIs Matter
From event loop to real bars
In Introduction to Live Algo Trading with R, you built the mental model: a live system repeatedly receives an event, updates state, calculates features, and eventually makes a decision.
Now we need the first real input to that loop: OHLC bars from an API.
For a trading workflow, an API fetch is not just downloading a table. It defines:
- what timestamp means
- what price fields are trusted
- how much history you have
- how often you can request updates
- whether your later moving averages are built on clean data
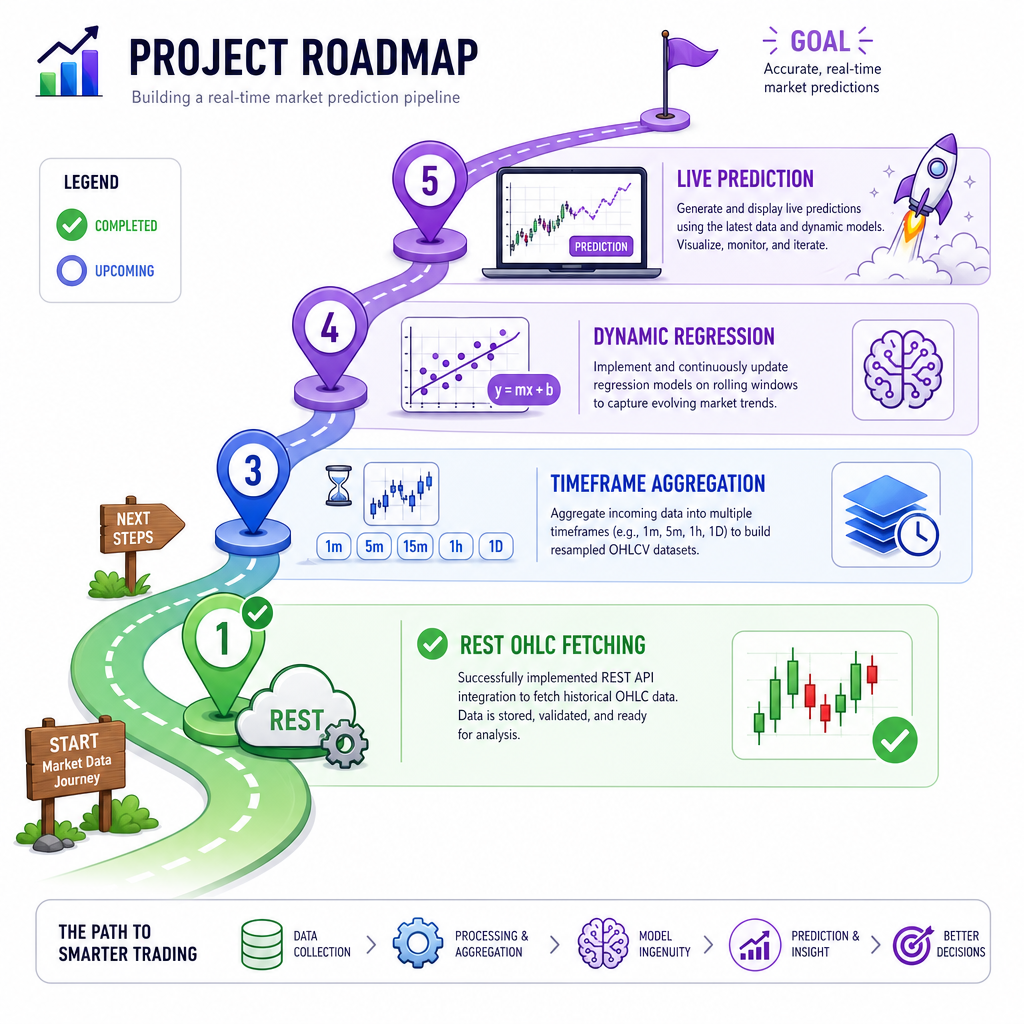
In this lesson, we stay focused on REST-style OHLC API fetching. WebSockets and live streaming come next.

The OHLC Contract
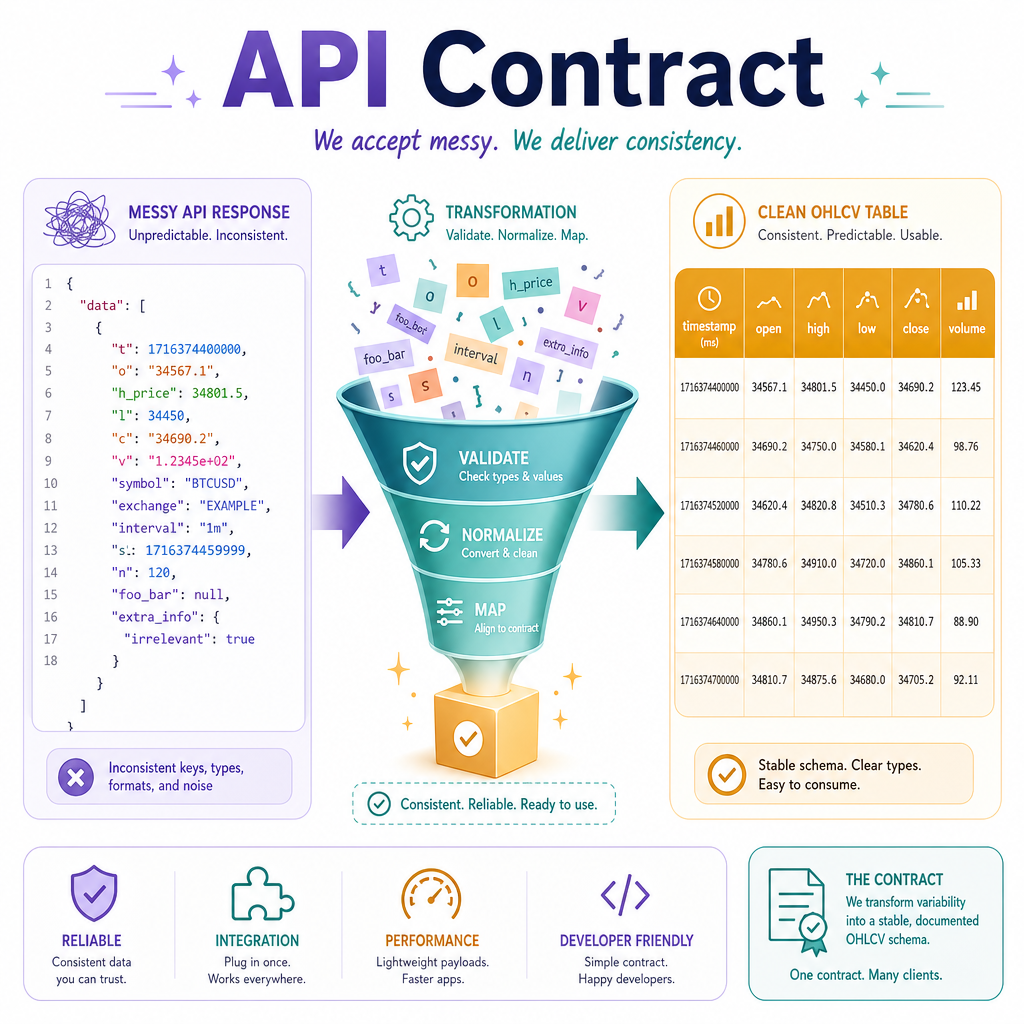
Treat the API response like a contract
Before you write strategy logic, decide the canonical bar shape your system expects.
A practical OHLC bar should contain:
Field Meaningtimestamp
bar start or close time, consistently defined
open
first traded price in the interval
high
highest traded price in the interval
low
lowest traded price in the interval
close
final traded price in the interval
volume
traded quantity during the interval
Your API may return t, o, h, l, c, v, or nested JSON. Your job is to normalize it into one shape before later calculations.
Think of this as protecting the one-row concept from the previous lesson: every later row should mean the same thing.
Normalize One Response
Convert provider JSON into canonical bars
Real providers all have slightly different response shapes. The safest pattern is:
- Receive raw response
- Rename fields into your canonical names
- Parse timestamps
- Sort by time
- Print or log enough to verify the result
The example below uses a mocked API response so it runs anywhere. In a real system, the raw_response object would come from requests.get(...).json() or the equivalent R HTTP client.
```python
from datetime import datetime, timezone
import pandas as pd

# Mocked provider response: many APIs use short keys like t/o/h/l/c/v.
raw_response = {
    "symbol": "SPY",
    "timeframe": "1s",
    "bars": [
        {"t": "2026-04-27T13:30:00Z", "o": 510.10, "h": 510.12, "l": 510.05, "c": 510.08, "v": 1200},
        {"t": "2026-04-27T13:30:01Z", "o": 510.08, "h": 510.20, "l": 510.07, "c": 510.18, "v": 950},
        {"t": "2026-04-27T13:30:02Z", "o": 510.18, "h": 510.22, "l": 510.15, "c": 510.16, "v": 1100}
    ]
}

df = pd.DataFrame(raw_response["bars"]).rename(columns={
    "t": "timestamp",
    "o": "open",
    "h": "high",
    "l": "low",
    "c": "close",
    "v": "volume"
})

df["timestamp"] = pd.to_datetime(df["timestamp"], utc=True)
df = df.sort_values("timestamp").reset_index(drop=True)

print("Canonical OHLCV bars:")
print(df)
print("\nDtypes:")
print(df.dtypes)
```
Canonical Fields Check
Which set of fields is the best canonical minimum for OHLC bar data that will later feed moving averages and model features?
Request Parameters Matter
The URL is part of your data quality
For OHLC APIs, the parameters are not administrative details. They define the data you receive.
Common parameters include:
-
symbol: instrument, such as SPY, BTCUSD, ES -
timeframe: bar size, such as 1s, 1m, 5m -
start: beginning of requested history -
end: end of requested history -
limit: maximum bars returned -
adjustment: raw, split-adjusted, dividend-adjusted, depending on market
A bad parameter can silently poison your later calculations. For example, requesting daily bars when you thought you requested seconds will still produce a table, but not the table your live loop expects.
```python
from urllib.parse import urlencode
from datetime import datetime, timezone

base_url = "https://api.examplebroker.com/v1/ohlc"
params = {
    "symbol": "SPY",
    "timeframe": "1s",
    "start": "2026-04-27T13:30:00Z",
    "end": "2026-04-27T13:30:10Z",
    "limit": 10000,
    "adjustment": "raw"
}

url = base_url + "?" + urlencode(params)

start = datetime.fromisoformat(params["start"].replace("Z", "+00:00"))
end = datetime.fromisoformat(params["end"].replace("Z", "+00:00"))
seconds_requested = int((end - start).total_seconds())

print("Request URL:")
print(url)
print(f"Seconds requested: {seconds_requested}")
print(f"Expected max 1-second bars: {seconds_requested + 1}")
```
REST Latency Tradeoff
A REST OHLC endpoint is usually the best tool for the lowest-latency tick-by-tick updates.
Pagination And Limits
APIs rarely give unlimited history
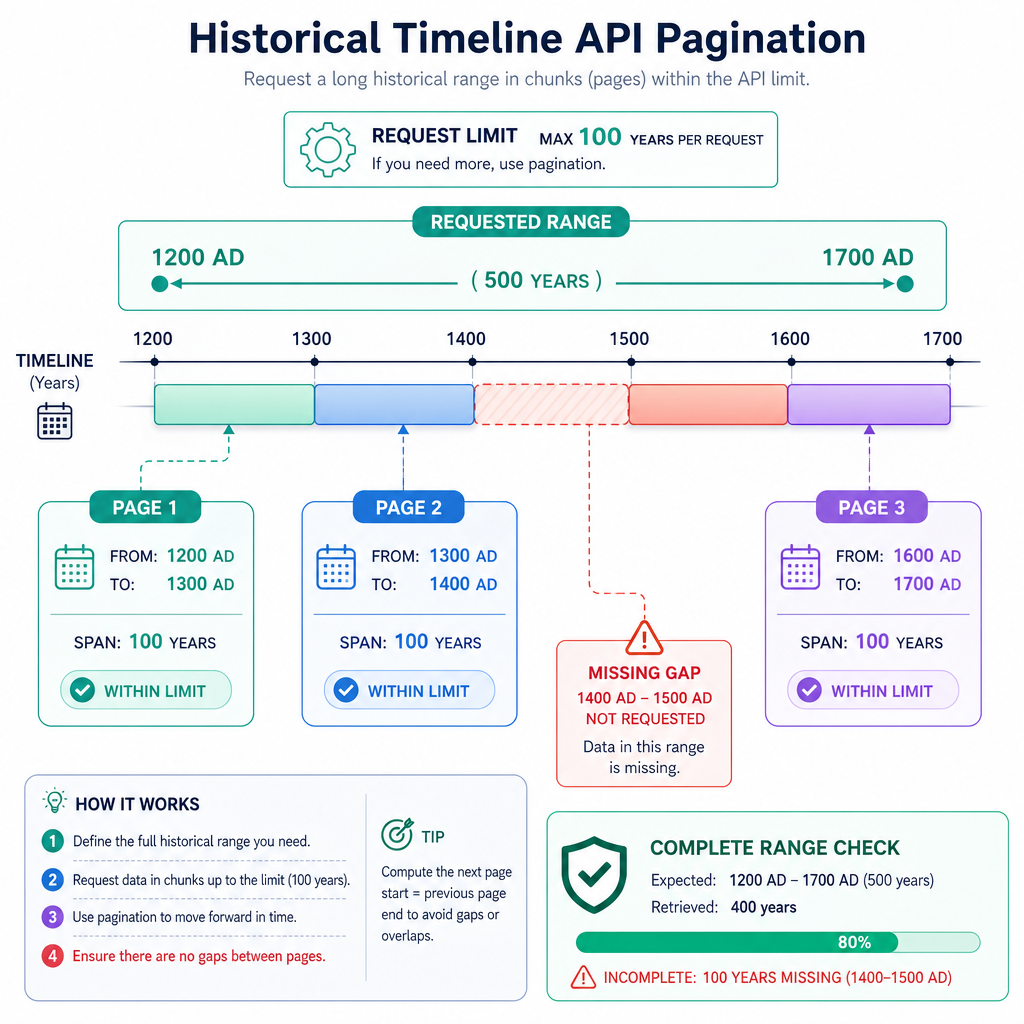
Most OHLC APIs enforce limits:
- maximum rows per request
- requests per minute
- allowed date range
- market-data subscription permissions
- delayed versus real-time entitlements
So a production fetcher often needs pagination:
start ------------------------------ end
  |---- page 1 ----|
                  |---- page 2 ----|
                                  |---- page 3 ----|
For this lesson, the key idea is simple: your fetch function should know whether it received the complete requested range or only the first page.
That matters because an incomplete backfill can make a 21-period calculation look valid when it was actually built from missing bars.
Timezone Normalization
To keep bars from different API calls aligned, timestamps should usually be normalized to the same global timezone: ____.
Guard The Schema
Validate before indicators
Do not send raw API rows directly into strategy calculations.
At minimum, check:
- required columns exist
- timestamps parse successfully
- rows are sorted
- duplicate timestamps are resolved
- obvious bad bars are rejected, such as
high < low
This is boring code, but it prevents exciting losses. Your future moving-average and regression code can only be as trustworthy as the bars entering it.
```python
import pandas as pd

raw_rows = [
    {"timestamp": "2026-04-27T13:30:02Z", "open": 510.18, "high": 510.22, "low": 510.15, "close": 510.16, "volume": 1100},
    {"timestamp": "2026-04-27T13:30:00Z", "open": 510.10, "high": 510.12, "low": 510.05, "close": 510.08, "volume": 1200},
    {"timestamp": "2026-04-27T13:30:01Z", "open": 510.08, "high": 510.20, "low": 510.07, "close": 510.18, "volume": 950},
    {"timestamp": "2026-04-27T13:30:01Z", "open": 510.09, "high": 510.19, "low": 510.06, "close": 510.17, "volume": 900},
    {"timestamp": "2026-04-27T13:30:03Z", "open": 510.16, "high": 510.10, "low": 510.20, "close": 510.12, "volume": 700}
]

required = ["timestamp", "open", "high", "low", "close", "volume"]
df = pd.DataFrame(raw_rows)

missing = sorted(set(required) - set(df.columns))
if missing:
    raise ValueError(f"Missing required columns: {missing}")

df["timestamp"] = pd.to_datetime(df["timestamp"], utc=True, errors="coerce")
df = df.dropna(subset=["timestamp"])

# Reject impossible bars.
df = df[df["high"] >= df["low"]]

# Sort and keep the latest row for duplicate timestamps.
df = df.sort_values("timestamp").drop_duplicates("timestamp", keep="last")
df = df.reset_index(drop=True)

print("Validated bars:")
print(df)
print(f"Rows kept: {len(df)}")
```
Ready For Streaming
What you can now trust
You now have the REST-fetching foundation for the live algo pipeline:
API response
   -> canonical OHLCV schema
   -> UTC timestamps
   -> sorted, validated bars
   -> ready for stateful updates
This lesson intentionally stopped before real-time streaming and timeframe aggregation. Those are separate layers.
Next, in Real-time Data Handling with WebSockets in R, you will connect this clean historical-fetch mindset to a live event stream. The same OHLC contract will keep the system consistent as updates arrive.