Financial Data Analysis with C++
Read at your own pace. Code execution, quizzes, progress tracking, and the AI tutor are available in the interactive view with JavaScript enabled.
Final Finance Skill
From C++ syntax to financial insight
Now that you've completed Introduction to C++, C++ for Finance Basics, Algorithmic Trading with C++, and Risk Management in C++, you're ready for the connective tissue: financial data analysis.
In real finance work, the job is rarely just “write a trading strategy” or “compute VaR.” First, you need to answer:
- Is this data trustworthy?
- What changed over time?
- Which features explain returns, risk, or behavior?
- Can I turn raw rows into useful signals?
Think of this like reviewing basketball game logs before designing a training plan: raw points/rebounds/minutes are not the insight. The insight comes after cleaning, normalizing, comparing, and visualizing.
In this final lesson, we'll use C++ to build a practical analysis workflow:
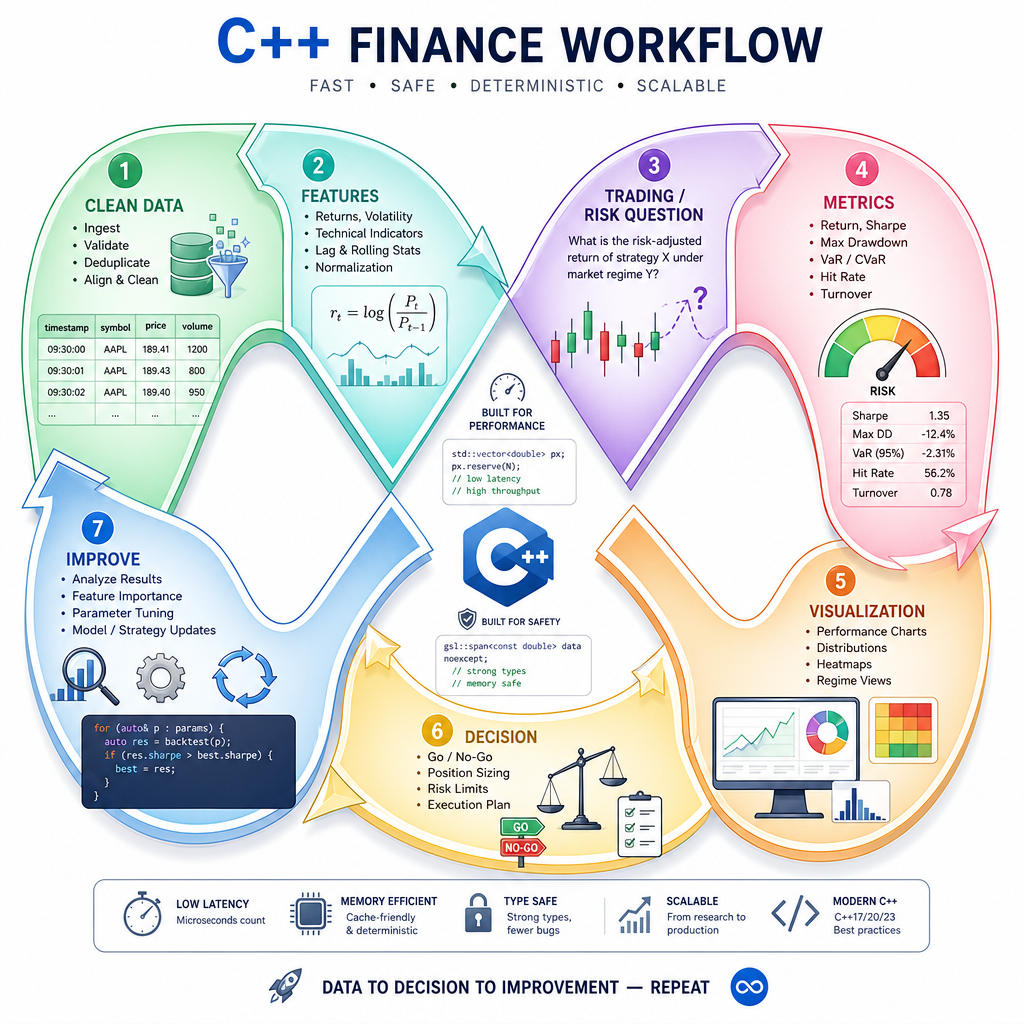
raw data -> cleaned data -> returns/features -> statistics -> visual summary -> decision
Analysis Pipeline
The workflow finance teams trust
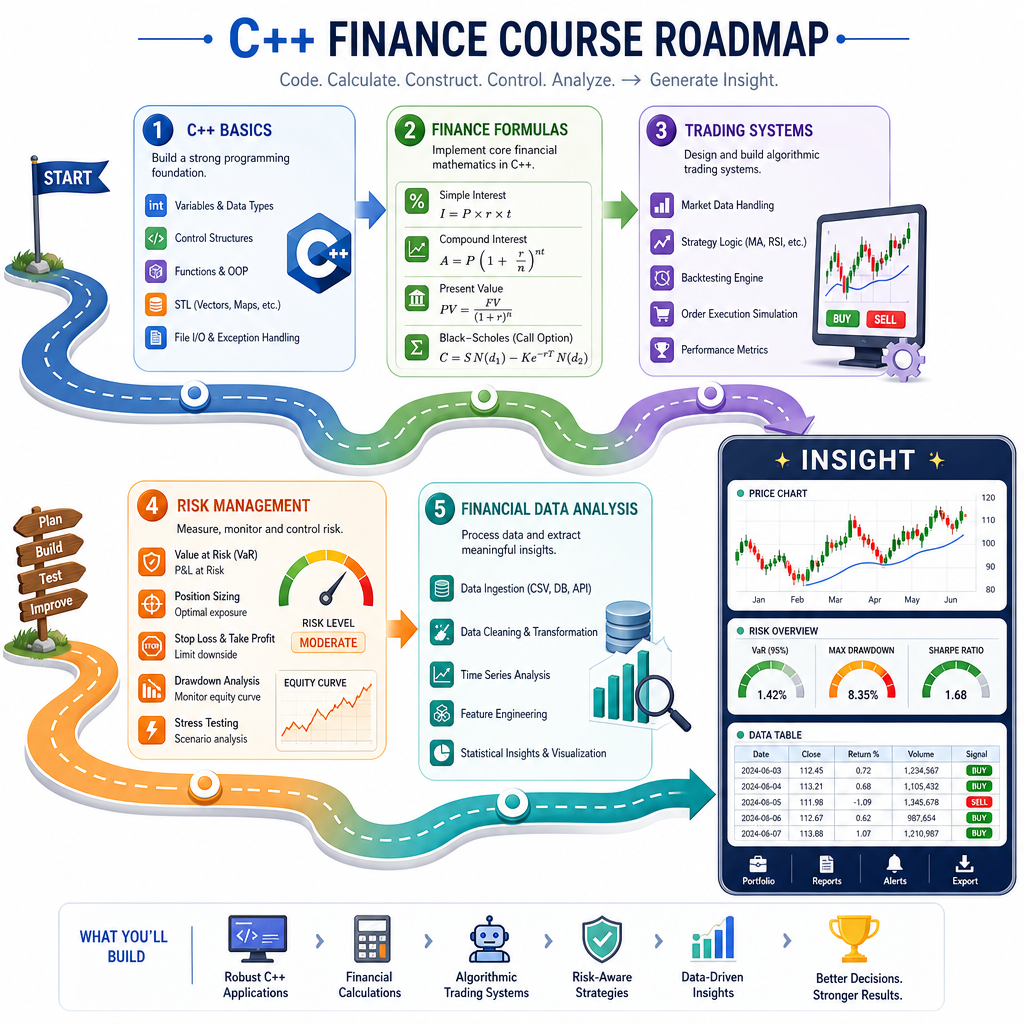
Financial data analysis is less about one magic formula and more about a repeatable pipeline.
1. Ingest      Read CSV/API/database rows
2. Validate    Detect missing, impossible, duplicated values
3. Transform   Compute returns, rolling averages, features
4. Analyze     Mean, volatility, drawdown, correlations
5. Present     Tables, CSV exports, charts, dashboards
As a web developer, this should feel familiar: it is like an ETL pipeline plus domain-specific math. The difference is that financial mistakes can be expensive. A silent bad price can distort a signal, a backtest, or a risk estimate.
C++ is useful here because it gives you:
- predictable performance on large datasets
- explicit control over numeric types
- fast loops for simulations and rolling calculations
- strong integration potential with trading/risk systems
Clean Price Rows
Cleaning is part of the model
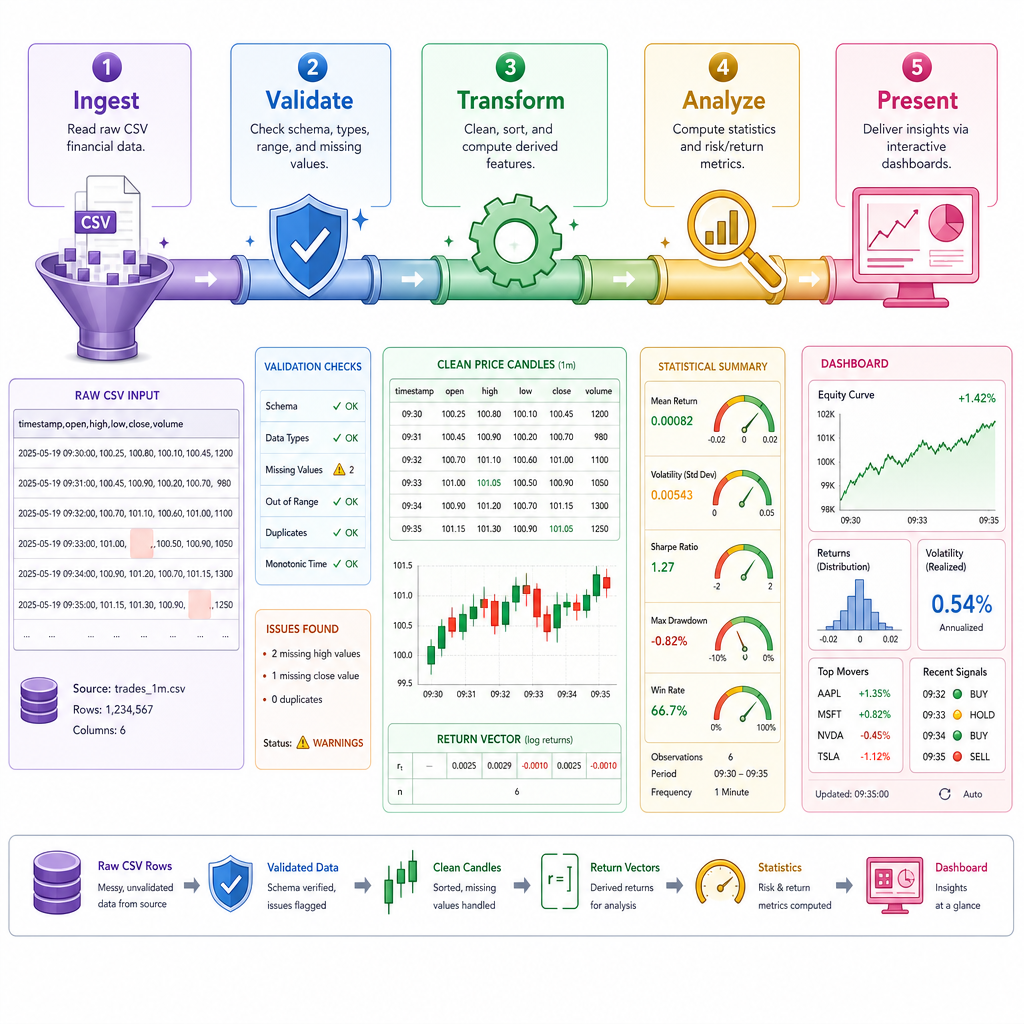
Before calculating returns or building features, we need to reject obviously bad observations.
Common issues in market datasets:
- missing prices
- zero or negative prices
- malformed rows
- duplicate dates
- unexpected symbols or stale values
The code below parses a tiny CSV-like price feed, keeps valid rows, and logs what was rejected. In production, you would also track vendor, timestamp, timezone, corporate actions, and adjustment rules — but this is the core habit.
```cpp
#include <iostream>
#include <sstream>
#include <string>
#include <vector>
#include <iomanip>

struct PriceRow {
    std::string date;
    double close;
};

int main() {
    std::string csv =
        "date,close\n"
        "2024-01-02,100.25\n"
        "2024-01-03,101.10\n"
        "2024-01-04,\n"
        "2024-01-05,-3.50\n"
        "2024-01-08,102.40\n";

    std::istringstream input(csv);
    std::string line;
    std::vector<PriceRow> clean;
    int rejected = 0;

    std::getline(input, line); // header

    while (std::getline(input, line)) {
        std::istringstream row(line);
        std::string date, closeText;

        std::getline(row, date, ',');
        std::getline(row, closeText, ',');

        if (date.empty() || closeText.empty()) {
            ++rejected;
            continue;
        }

        double close = 0.0;
        try {
            close = std::stod(closeText);
        } catch (...) {
            ++rejected;
            continue;
        }

        if (close <= 0.0) {
            ++rejected;
            continue;
        }

        clean.push_back({date, close});
    }

    std::cout << "Clean rows:\n";
    for (const auto& r : clean) {
        std::cout << r.date << " close=" << std::fixed << std::setprecision(2) << r.close << "\n";
    }
    std::cout << "Rejected rows: " << rejected << "\n";

    return 0;
}
```
Cleaning Check
You receive a CSV of daily closing prices from a new data vendor. Before calculating returns, what is the best first step?
Returns And Stats
Turn prices into behavior
A price series is useful, but most analysis starts with returns because returns make assets more comparable.
From earlier lessons, you've already seen that finance cares about rates of change, compounding, and risk. Here we turn cleaned prices into:
- daily returns
- average daily return
- annualized volatility
- max drawdown
These are not just textbook metrics. They show up in trading research, portfolio reviews, risk dashboards, and performance reports.
```cpp
#include <cmath>
#include <iomanip>
#include <iostream>
#include <numeric>
#include <vector>

int main() {
    std::vector<double> prices = {100.25, 101.10, 102.40, 101.80, 104.20, 103.50};
    std::vector<double> returns;

    for (std::size_t i = 1; i < prices.size(); ++i) {
        returns.push_back((prices[i] / prices[i - 1]) - 1.0);
    }

    double mean = std::accumulate(returns.begin(), returns.end(), 0.0) / returns.size();

    double variance = 0.0;
    for (double r : returns) {
        variance += (r - mean) * (r - mean);
    }
    variance /= (returns.size() - 1);

    double dailyVol = std::sqrt(variance);
    double annualizedVol = dailyVol * std::sqrt(252.0);

    double peak = prices[0];
    double maxDrawdown = 0.0;
    for (double p : prices) {
        if (p > peak) peak = p;
        double drawdown = (p / peak) - 1.0;
        if (drawdown < maxDrawdown) maxDrawdown = drawdown;
    }

    std::cout << std::fixed << std::setprecision(4);
    std::cout << "Daily returns:\n";
    for (double r : returns) {
        std::cout << r * 100.0 << "%\n";
    }

    std::cout << "Mean daily return: " << mean * 100.0 << "%\n";
    std::cout << "Annualized volatility: " << annualizedVol * 100.0 << "%\n";
    std::cout << "Max drawdown: " << maxDrawdown * 100.0 << "%\n";

    return 0;
}
```
Bias Warning
True or false: If you delete missing or suspicious prices without tracking why they were removed, your analysis or backtest can become biased.
Rolling Features
Features are reusable measurements
In Algorithmic Trading with C++, you saw that signals often come from features. In analysis work, features also help you explain behavior.
Examples:
- rolling average return
- rolling volatility
- price versus moving average
- volume spike ratio
- drawdown from recent peak
This is similar to bodybuilding progress tracking: one weigh-in is noisy, but a rolling average tells you whether the trend is actually moving.
The example below computes a simple moving average and compares each price to it.
```cpp
#include <iomanip>
#include <iostream>
#include <string>
#include <vector>

int main() {
    std::vector<std::string> dates = {
        "Mon", "Tue", "Wed", "Thu", "Fri", "Mon2", "Tue2"
    };
    std::vector<double> prices = {100.0, 101.0, 102.5, 101.5, 103.0, 104.0, 102.0};
    const int window = 3;

    std::cout << std::fixed << std::setprecision(2);
    std::cout << "Date   Price   SMA(3)  Price-vs-SMA\n";

    for (std::size_t i = 0; i < prices.size(); ++i) {
        std::cout << dates[i] << "   " << prices[i] << "   ";

        if (i + 1 < static_cast<std::size_t>(window)) {
            std::cout << "n/a     n/a\n";
            continue;
        }

        double sum = 0.0;
        for (std::size_t j = i + 1 - window; j <= i; ++j) {
            sum += prices[j];
        }

        double sma = sum / window;
        double distance = (prices[i] / sma) - 1.0;

        std::cout << sma << "  " << distance * 100.0 << "%\n";
    }

    return 0;
}
```
Name The Series
The series computed as (price_t / price_{t-1}) - 1 is called ____.
Present The Insight
Visualization is part of analysis
C++ is not usually chosen for beautiful charting. In finance, a common pattern is:
C++ engine computes clean metrics
        |
        v
CSV / database / API output
        |
        v
Python, R, Excel, web dashboard, BI tool
But you still need to think visually while writing C++.
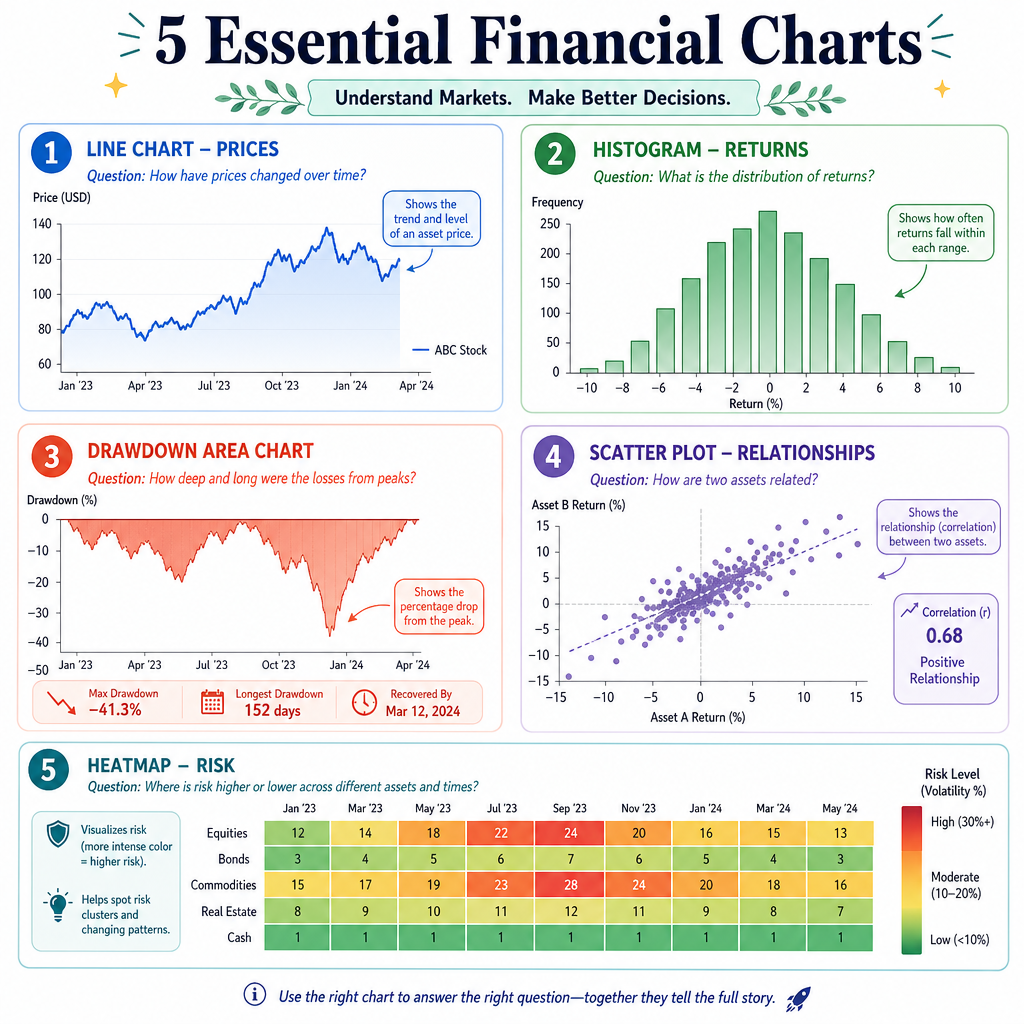
Good financial visualizations answer focused questions:
- Line chart: How did price or equity curve evolve?
- Histogram: What does the return distribution look like?
- Drawdown chart: How painful were losses over time?
- Scatter plot: Do two variables move together?
- Heatmap: Which assets or periods carry the most risk?
The goal is not decoration. It is faster judgment. A portfolio manager, quant researcher, or risk lead should be able to see the important pattern quickly.
Course Capstone
You now have the finance C++ loop
Across this course, you built a practical foundation:
- Introduction to C++: syntax, functions, control flow, compiled thinking
- C++ for Finance Basics: money variables, compounding, cash flows, precision
- Algorithmic Trading with C++: market data, signals, backtesting boundaries
- Risk Management in C++: VaR, simulation, portfolio risk, controls
- Financial Data Analysis with C++: cleaning, transforming, measuring, presenting
A simple professional workflow now looks like this:
Clean data
  -> compute returns/features
  -> test strategy or risk question
  -> measure performance and downside
  -> export results for review
  -> improve assumptions
For your next portfolio project, build one small end-to-end C++ tool:
- Load daily prices for 2–5 assets.
- Clean invalid rows and log rejections.
- Compute returns, volatility, drawdown, and rolling averages.
- Export a summary CSV.
- Explain the result in plain English.
That kind of project shows finance teams something important: you can move from raw data to decision-quality insight.