Fundamental Understanding
Read at your own pace. Code execution, quizzes, progress tracking, and the AI tutor are available in the interactive view with JavaScript enabled.
Welcome To Foundations
Why this lesson matters
Machine learning can feel like magic at first: give a program data, and it starts making predictions.
But underneath the magic are a few dependable ideas:
- Statistics helps us summarize what happened.
- Probability helps us reason about uncertainty.
- Linear algebra helps us represent many values at once.
- Evaluation and optimization help us ask: “Is this model actually improving?”
This is the first lesson in the course, so we’ll build the mental map you’ll use later when writing Python, training models, and eventually building a predictive model of your own.

The ML Loop
Machine learning in one loop
At a high level, machine learning is about finding patterns in data and using those patterns to make useful predictions.
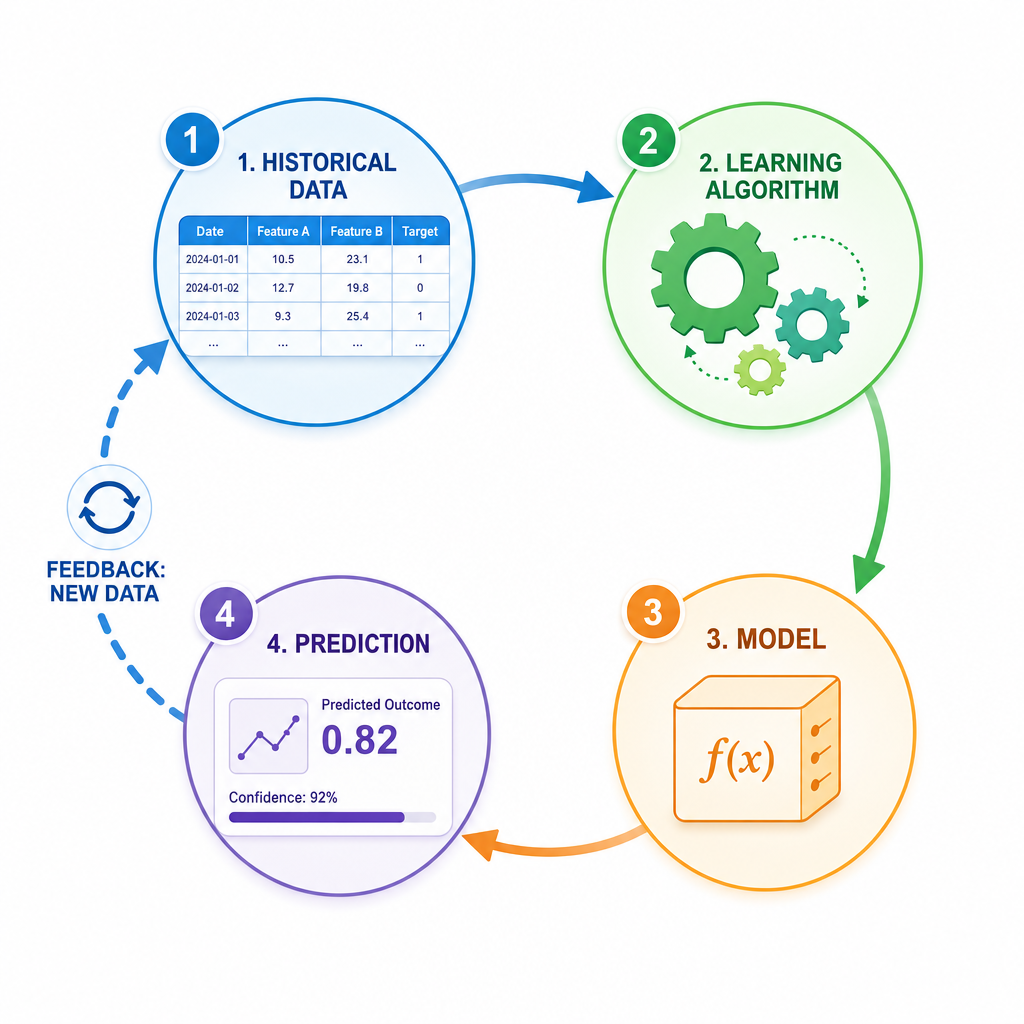
A simple predictive loop looks like this:
historical data -> learning algorithm -> model -> prediction
For example:
- Past house data: size, location, age, sale price
- Learning algorithm: finds relationships in the data
- Model: captures the learned pattern
- Prediction: estimates the price of a new house
This lesson focuses on the conceptual ingredients behind that loop—not on training a real model yet.
Statistics Summarize Data
Statistics: compressing reality
Real datasets are often too large to understand row by row. Statistics gives us compact summaries.
Two useful ideas:
- Mean: the average value
- Spread: how much values vary around the average
In predictive analytics, these summaries help you notice whether data is typical, surprising, noisy, or possibly incorrect.
Here’s a tiny Python example using house prices.
```python
prices = [250000, 275000, 300000, 325000, 1000000]

mean_price = sum(prices) / len(prices)

squared_differences = []
for price in prices:
    squared_differences.append((price - mean_price) ** 2)

variance = sum(squared_differences) / len(prices)

print("Prices:", prices)
print("Mean price:", round(mean_price, 2))
print("Variance:", round(variance, 2))
```
Summary Check
A data scientist calculates one number to represent the “typical” value in a list of house prices.
Which concept are they most likely using?
Probability Models Uncertainty
Probability: measured uncertainty
Predictions are rarely guarantees.
A model might say:
- “This customer is 80% likely to renew.”
- “This image is 92% likely to contain a dog.”
- “This home price estimate is likely between two values.”
Probability gives us a language for uncertainty. Instead of saying “this will happen,” we say “given what we know, this is how likely it seems.”
Let’s simulate a biased event in Python.
```python
import random

random.seed(7)

renewal_probability = 0.8
trials = 20
renewals = 0

for _ in range(trials):
    if random.random() < renewal_probability:
        renewals += 1

print("Trials:", trials)
print("Renewals observed:", renewals)
print("Observed renewal rate:", renewals / trials)
```
Uncertainty Check
True or false?
A probability of 0.8 means an event is guaranteed to happen.
Vectors Hold Features
Linear algebra: data as organized numbers
Machine learning models usually do not “see” a house, customer, or image the way humans do.
They see numbers.
A single example can be represented as a vector:
house = [size_sqft, bedrooms, age_years]
A model can also store numbers that describe how important each feature is. A very simple prediction can come from multiplying matching values and adding them up.
```python
# A house represented as features:
# [size in thousands of sqft, bedrooms, age in decades]
house = [2.0, 3, 1.5]

# Model weights: how much each feature contributes
weights = [120000, 25000, -10000]
base_price = 50000

prediction = base_price
for feature_value, weight in zip(house, weights):
    prediction += feature_value * weight

print("House features:", house)
print("Predicted price:", prediction)
```
Average Blank
Fill in the blank:
The ______ is calculated by adding all values and dividing by the number of values.
Before Modeling
Three questions before trusting a model
Even before we build a full model, we need the habit of asking careful questions.
1. Is the data usable?
Data may contain missing values, inconsistent formats, duplicates, or extreme outliers.
2. Is the model good?
A prediction is only useful if we can compare it against reality using clear evaluation rules.
3. Can the model improve?
Optimization is the process of adjusting a model so its predictions become better according to some goal.
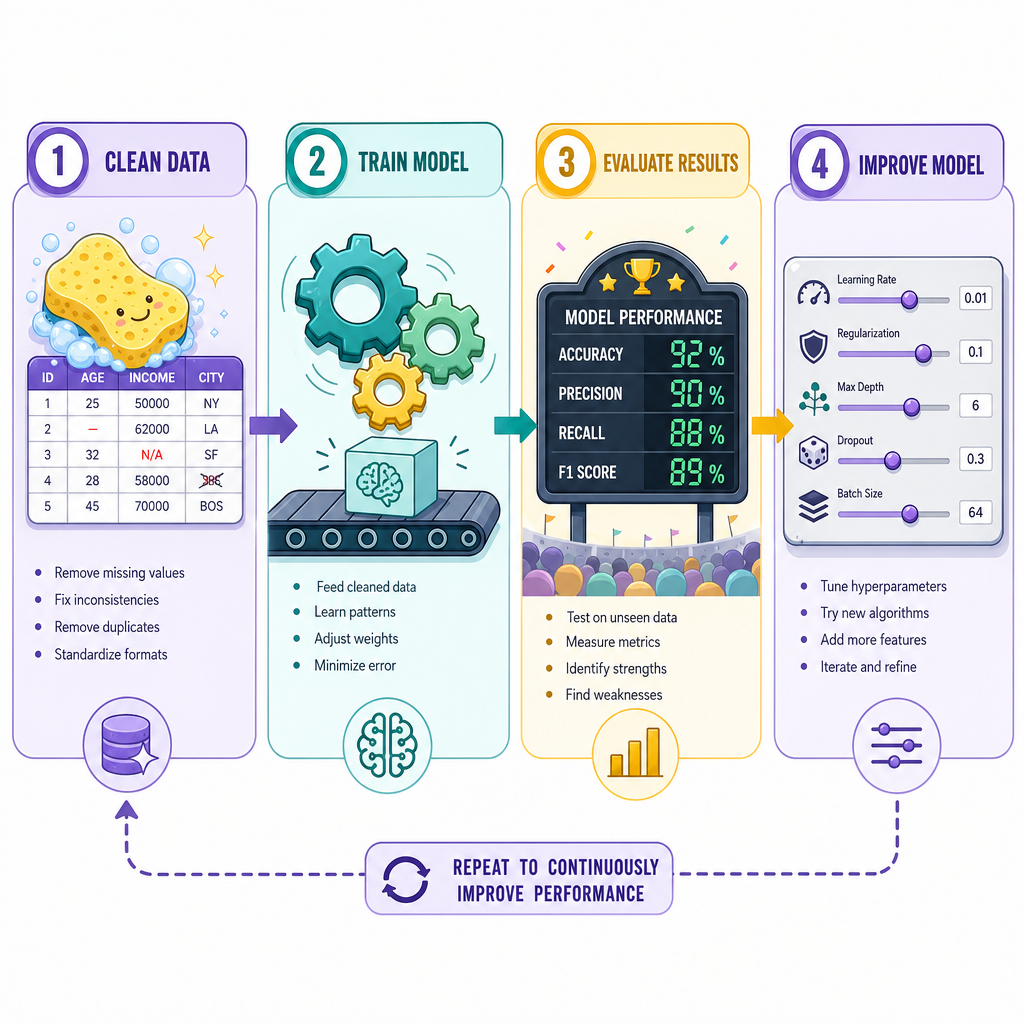
For now, just remember the flow:
clean data -> train model -> evaluate results -> improve model
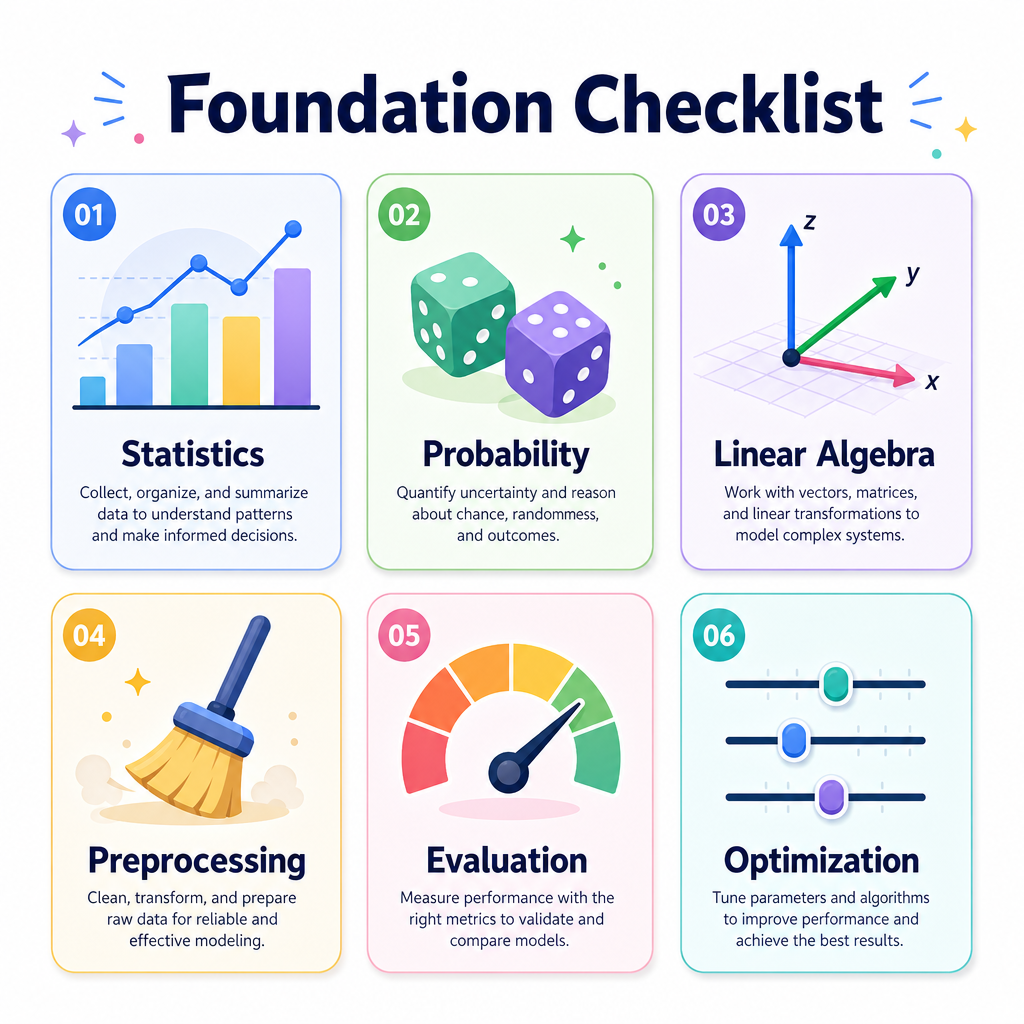
Foundation Checklist
What you should carry forward
You do not need to master all the math today. The goal is to recognize what each foundation is for.
Keep this checklist in mind:
- Statistics: What does the data look like overall?
- Probability: How uncertain is this prediction?
- Linear algebra: How do we represent examples as numbers?
- Preprocessing: Is the data ready to use?
- Evaluation: How do we know if predictions are good?
- Optimization: How does a model improve?
Next, in Skill Development, we’ll start turning these ideas into practical Python habits for machine learning.