Introduction to Data Science
Read at your own pace. Code execution, quizzes, progress tracking, and the AI tutor are available in the interactive view with JavaScript enabled.
Why Data Science
Welcome to the course
This course starts with data science because it gives you a practical way to turn raw information into decisions. With your software background, you already understand systems, APIs, databases, and backend logic; data science adds a disciplined way to ask: What can the data tell us, and how confident are we?
In this lesson, we’ll build a clear mental model for data science using Python. Later lessons will introduce quantum computing, artificial intelligence, and website development, but here we’ll stay focused on the data science workflow itself.
By the end, you should be able to describe what data science is, recognize its core lifecycle, and run small Python examples that extract useful insight from data.

The Core Idea
Data science in one sentence
Data science is the practice of using data, computation, statistics, and domain knowledge to answer questions and support decisions.
It is not just writing Python or making charts. A good data scientist moves between several modes:
- Question framing: What are we trying to learn or decide?
- Data understanding: What data exists, and what does it actually mean?
- Analysis: What patterns, relationships, or anomalies appear?
- Modeling: Can we estimate, classify, forecast, or explain something?
- Communication: Can another person act on the result?
A helpful mental model:
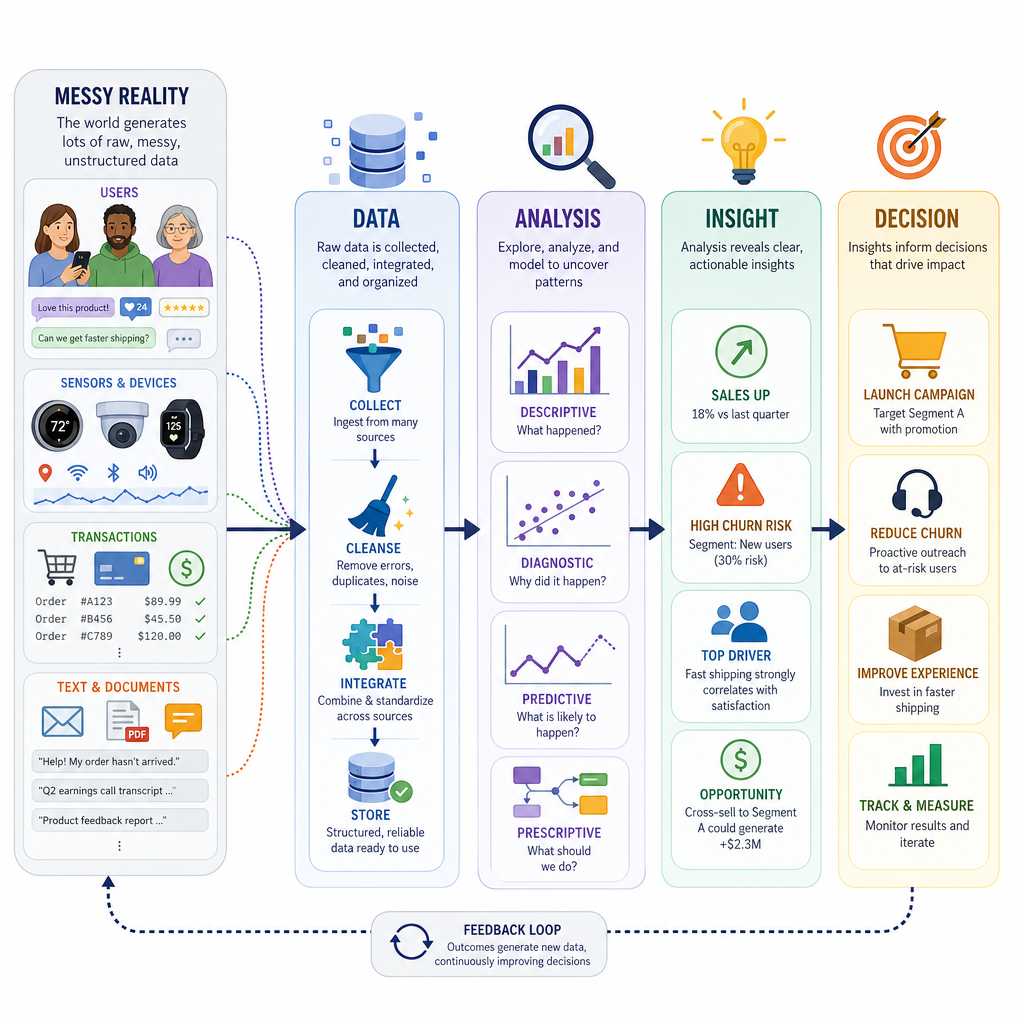
Messy reality -> Data -> Analysis -> Insight -> Decision
The key skill is not merely producing output. It is producing trustworthy output.
App Data Example
From application events to insight
Coming from Angular and .NET backend work, you can think of many datasets as records emitted by software systems: page views, API calls, purchases, errors, support tickets, or user sessions.
Here is a tiny example: we have website visit events and want to know which referrer produced the best conversion rate. This is a simple data science move: aggregate raw events into a decision-oriented metric.
```python
import csv
from io import StringIO
from collections import defaultdict

raw_data = """user_id,referrer,purchased
1,search,true
2,social,false
3,search,true
4,email,false
5,social,true
6,search,false
7,email,true
8,search,true
9,social,false
10,email,true
"""

reader = csv.DictReader(StringIO(raw_data))
stats = defaultdict(lambda: {"visits": 0, "purchases": 0})

for row in reader:
    referrer = row["referrer"]
    stats[referrer]["visits"] += 1
    if row["purchased"] == "true":
        stats[referrer]["purchases"] += 1

for referrer, values in sorted(stats.items()):
    rate = values["purchases"] / values["visits"]
    print(f"{referrer}: {values['purchases']}/{values['visits']} converted = {rate:.0%}")
```
Spot The Question
Which of these is the best example of a data science question?
The Lifecycle
Data science is a lifecycle
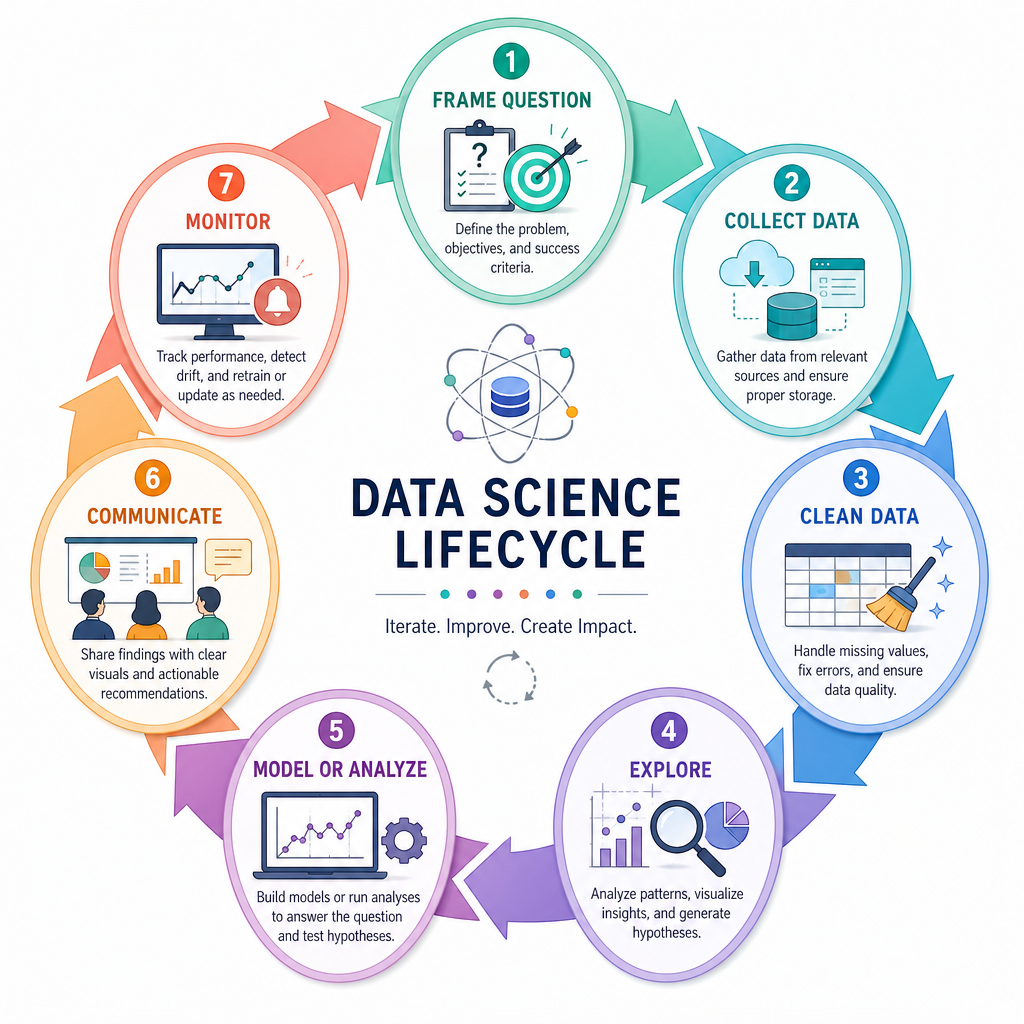
Real data science is rarely linear. You often discover that your question is vague, your data is incomplete, or your early result is misleading. A practical lifecycle looks like this:
- Frame the question — define the decision or hypothesis.
- Collect data — gather relevant records, logs, files, APIs, or databases.
- Clean data — handle missing values, inconsistent formats, duplicates, and bad records.
- Explore data — summarize, visualize, and look for patterns.
- Model or analyze — estimate relationships, test assumptions, or predict outcomes.
- Communicate — explain the result clearly, including uncertainty.
- Monitor — check whether conclusions still hold as data changes.
The loop matters. If exploration reveals that your data cannot answer the original question, the professional move is to revise the question or collect better data.
Cleaning Is Final
True or false: Data cleaning is usually a one-time step that happens before analysis and does not need to be revisited.
Explore With Python
Exploratory data analysis
Before building anything sophisticated, data scientists usually perform exploratory data analysis, often shortened to EDA.
EDA is where you ask:
- What are the typical values?
- How much variation is there?
- Are there missing or suspicious values?
- Do variables appear related?
- What should we investigate next?
Here is a small Python example using only the standard library.
```python
import statistics as stats

page_load_ms = [220, 240, 235, 260, 250, 245, 900, 255, 265, 238]

mean_load = stats.mean(page_load_ms)
median_load = stats.median(page_load_ms)
stdev_load = stats.pstdev(page_load_ms)

threshold = mean_load + 2 * stdev_load
outliers = [x for x in page_load_ms if x > threshold]

print(f"Mean load time: {mean_load:.1f} ms")
print(f"Median load time: {median_load:.1f} ms")
print(f"Population standard deviation: {stdev_load:.1f} ms")
print(f"Potential outliers above {threshold:.1f} ms: {outliers}")
```
Name The Stage
Fill in the blank: The stage where you summarize and inspect data to find patterns before formal modeling is called ______.
Tiny Predictive Model
From description to estimation
Data science often starts with describing what happened, then moves toward estimating what might happen under similar conditions.
The example below fits a simple straight-line relationship between ad spend and signups. This is not meant to introduce advanced AI; it is a basic statistical modeling idea: use past data to estimate a relationship, then use that relationship carefully.
A model is useful only if its assumptions are reasonable and its output is validated against reality.
```python
# Simple linear regression with only the Python standard library.
# Relationship: signups ~= intercept + slope * ad_spend

ad_spend = [100, 200, 300, 400, 500]
signups = [12, 19, 29, 37, 45]

x_mean = sum(ad_spend) / len(ad_spend)
y_mean = sum(signups) / len(signups)

numerator = sum((x - x_mean) * (y - y_mean) for x, y in zip(ad_spend, signups))
denominator = sum((x - x_mean) ** 2 for x in ad_spend)

slope = numerator / denominator
intercept = y_mean - slope * x_mean

new_spend = 650
predicted_signups = intercept + slope * new_spend

print(f"Model: signups = {intercept:.2f} + {slope:.3f} * ad_spend")
print(f"Predicted signups for ${new_spend}: {predicted_signups:.1f}")
```
Professional Judgment
What separates useful analysis from noise
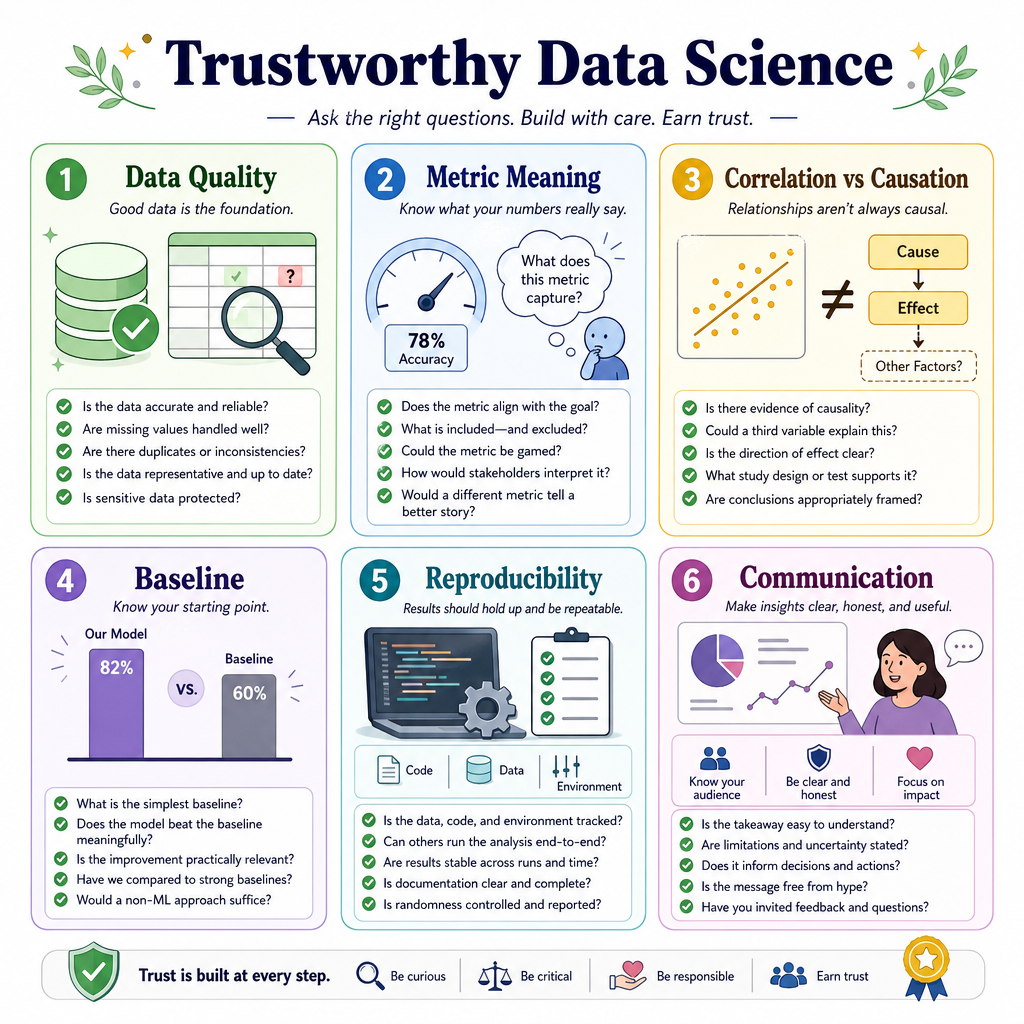
Data science is powerful, but it can mislead if practiced carelessly. As you work with data, keep these checks in mind:
- Data quality: Are values missing, duplicated, stale, biased, or incorrectly recorded?
- Metric meaning: Does the metric actually represent the thing you care about?
- Correlation vs. causation: Do two things move together, or does one actually cause the other?
- Baseline comparison: Is your result better than a simple default or historical average?
- Reproducibility: Can someone rerun your steps and get the same result?
- Communication: Can a stakeholder understand the conclusion and its limits?
This lesson gives us the data-centered foundation for the rest of the course. Next, we’ll shift from classical data workflows into a very different computing model: quantum computing.