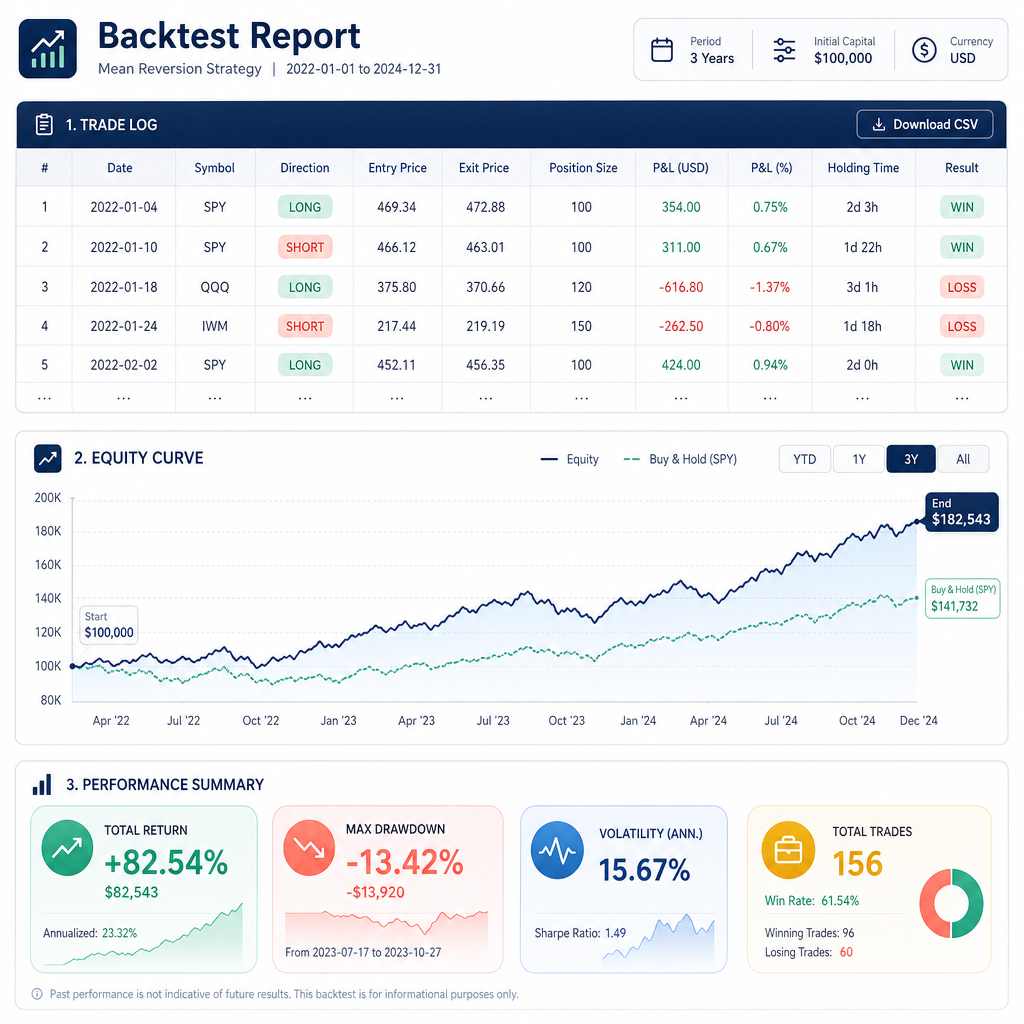
Backtesting and Performance Evaluation
Read at your own pace. Code execution, quizzes, progress tracking, and the AI tutor are available in the interactive view with JavaScript enabled.
Testing The Model
From signal to evidence
In Building Trading Models, you ended with model logic that can produce a trading intention from prepared time series: rule-based, parabolic, or multi-timeframe.
Now we ask a stricter question:
If this model had been run historically, what would have happened after realistic execution rules and risk accounting?
Backtesting is not a profit guarantee. It is a controlled experiment. It helps you find bugs, detect fragile assumptions, compare alternative algorithms, and decide whether a model deserves deeper research.
In this lesson, we will focus on:
- Running a deterministic bar-by-bar simulation
- Preventing future data from leaking into decisions
- Measuring returns, drawdowns, and risk-adjusted performance
- Accounting for costs and slippage
- Reading a backtest as evidence, not as hype
Next lesson, Live Trading and Deployment, will move from historical simulation to real-time operation. Today stays inside the lab.

Backtest Contract
Define the experiment before judging it
A backtest needs a clear contract. Without one, results become hard to trust or reproduce.
A useful contract includes:
- Input data: the cleaned candles and aggregated timeframes from Data Retrieval and Preprocessing
- Model output: target position, signal, or trade instruction from Building Trading Models
- Execution rule: when the trade is assumed to happen
- Portfolio state: cash, position, average entry, realized and unrealized PnL
- Friction model: commissions, spread, slippage, and minimum trade size
- Evaluation period: in-sample, out-of-sample, or segmented periods
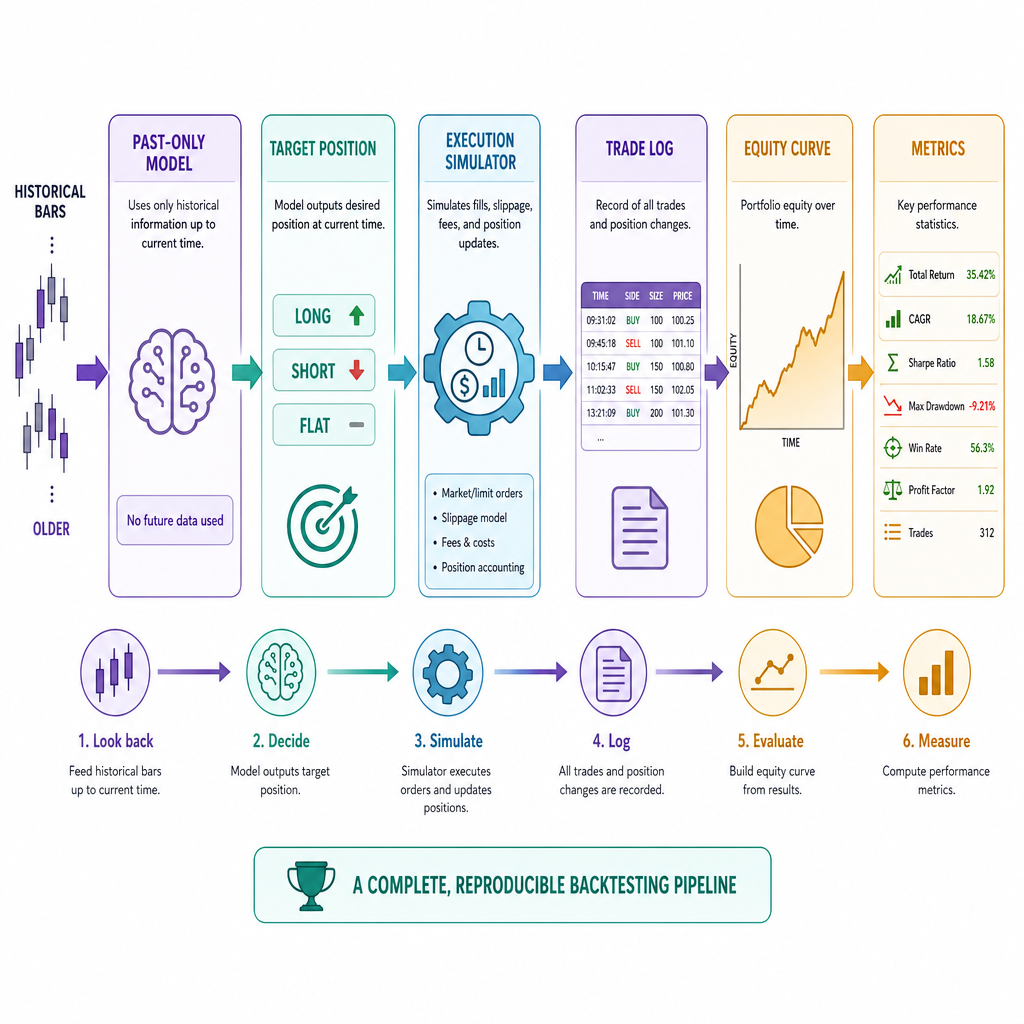
A common mental model:
historical bars
     ↓
model sees only past data
     ↓
target position
     ↓
execution simulator
     ↓
trade log + equity curve
     ↓
performance metrics
The important part is not making this complex. The important part is making it explicit.
Bar Event Loop
Simulate one decision at a time
The safest backtest structure is a bar event loop. Each iteration represents one moment in historical time.
At bar i, the model should only use information available before bar i is executed. This simple discipline prevents many expensive research mistakes.
The example below uses a tiny moving-average-style rule as a stand-in for your model. The key idea is the loop structure, not the signal itself:
- Use prior bars to decide the target position
- Execute on the current bar price
- Update cash, position, and equity
- Print the resulting trade/equity state
```cpp
#include <iostream>
#include <vector>
#include <string>
#include <iomanip>

struct Bar {
    std::string time;
    double close;
};

double sma(const std::vector<Bar>& bars, int exclusiveEnd, int period) {
    double sum = 0.0;
    for (int j = exclusiveEnd - period; j < exclusiveEnd; ++j) {
        sum += bars[j].close;
    }
    return sum / period;
}

int main() {
    std::vector<Bar> bars = {
        {"09:30", 100.0}, {"09:31", 101.0}, {"09:32", 102.0},
        {"09:33", 101.5}, {"09:34", 103.0}, {"09:35", 104.0},
        {"09:36", 102.5}, {"09:37", 105.0}
    };

    double cash = 10000.0;
    int position = 0; // shares
    const int period = 3;

    std::cout << std::fixed << std::setprecision(2);

    for (int i = period; i < static_cast<int>(bars.size()); ++i) {
        // Decision uses bars [i-period, i-1], never bar i future information.
        double pastAverage = sma(bars, i, period);
        int targetPosition = (bars[i - 1].close > pastAverage) ? 1 : 0;

        double executionPrice = bars[i].close;

        if (targetPosition != position) {
            int delta = targetPosition - position;
            cash -= delta * executionPrice;
            position = targetPosition;

            std::cout << bars[i].time
                      << " trade delta=" << delta
                      << " at " << executionPrice << "\n";
        }

        double equity = cash + position * executionPrice;
        std::cout << bars[i].time
                  << " equity=" << equity
                  << " position=" << position << "\n";
    }

    double finalEquity = cash + position * bars.back().close;
    std::cout << "Final equity: " << finalEquity << "\n";
    return 0;
}
```
Choose The Comparison
You run two versions of a parabolic curvature model from Building Trading Models. Which comparison is most scientifically useful?
Bias Traps
The backtest can lie politely
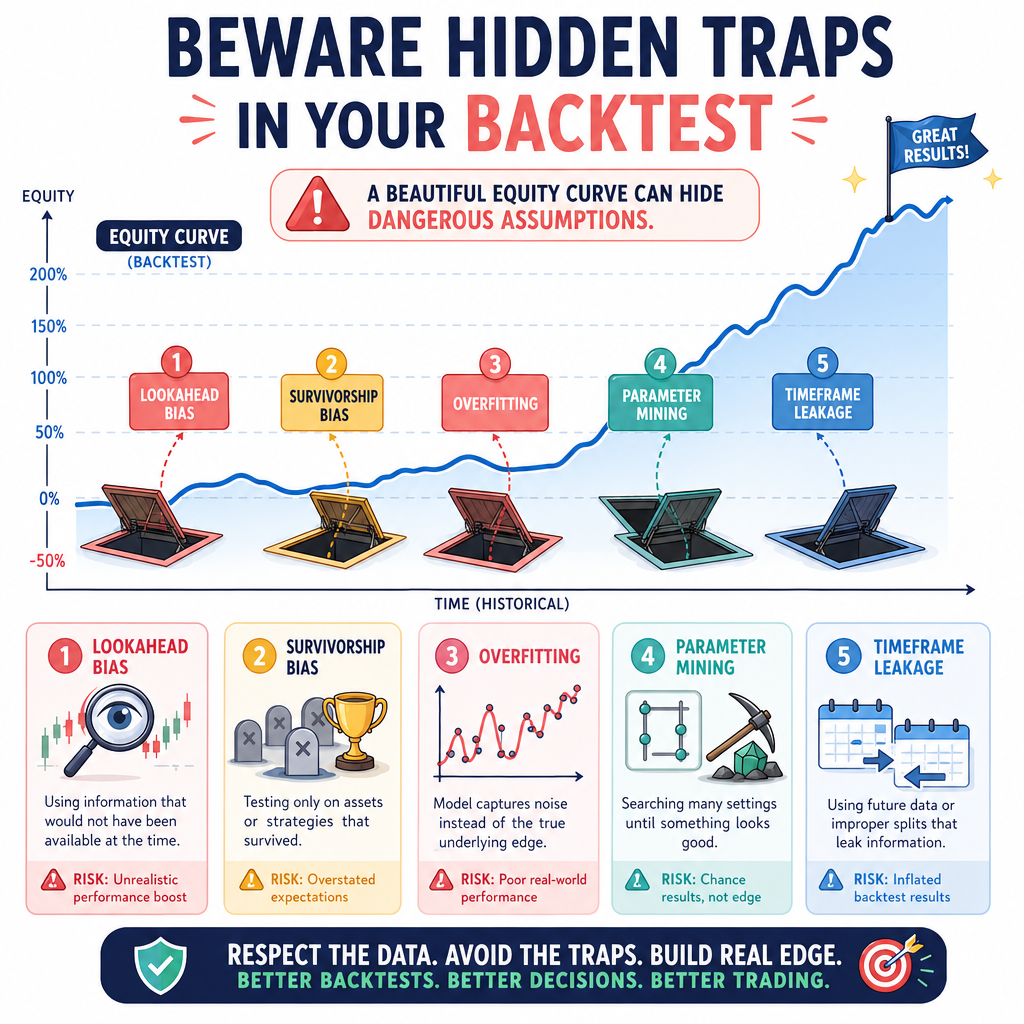
Most bad backtests do not fail loudly. They produce beautiful curves from hidden assumptions.
Watch for these traps:
Lookahead bias
The model uses information that was not available at decision time.
Example: using today's closing price to decide a trade that is also filled at today's close.
Survivorship bias
The dataset includes only assets that still exist today. Failed, delisted, or merged assets disappear, making history look cleaner than it was.
Overfitting
The strategy is tuned so tightly to historical noise that it loses generality.
Parameter mining
Trying many parameter combinations and reporting only the best one.
Timeframe leakage
A higher timeframe bar is treated as complete before it actually closes.
This matters especially for innovative alternative algorithms. The more flexible or unusual your model is, the more carefully you must protect the test boundary.
Spot The Bias
True or false: If a backtest computes a signal using the completed daily candle and assumes the trade was filled at that same daily candle's closing price, it may contain lookahead bias.
Performance Metrics
Profit alone is not enough
A final equity number tells you where the account ended. It does not tell you how painful, unstable, or risky the path was.
Useful first metrics:
- Total return: overall percentage gain or loss
- Max drawdown: worst peak-to-trough decline
- Average return: typical period-to-period return
- Volatility: variability of returns
- Sharpe-like ratio: return per unit of volatility
For trading systems, max drawdown is often the most emotionally honest metric. A strategy that makes 40% but falls 35% along the way may be harder to run than one that makes 18% with smaller drawdowns.
```cpp
#include <iostream>
#include <vector>
#include <cmath>
#include <numeric>
#include <iomanip>

int main() {
    std::vector<double> equity = {
        10000, 10150, 10080, 10300, 9900, 9800, 10450, 10600
    };

    std::vector<double> returns;
    for (size_t i = 1; i < equity.size(); ++i) {
        returns.push_back((equity[i] - equity[i - 1]) / equity[i - 1]);
    }

    double totalReturn = (equity.back() - equity.front()) / equity.front();

    double peak = equity.front();
    double maxDrawdown = 0.0;
    for (double value : equity) {
        if (value > peak) peak = value;
        double drawdown = (peak - value) / peak;
        if (drawdown > maxDrawdown) maxDrawdown = drawdown;
    }

    double mean = std::accumulate(returns.begin(), returns.end(), 0.0) / returns.size();

    double variance = 0.0;
    for (double r : returns) {
        variance += (r - mean) * (r - mean);
    }
    variance /= returns.size();
    double volatility = std::sqrt(variance);

    double sharpeLike = (volatility == 0.0) ? 0.0 : mean / volatility;

    std::cout << std::fixed << std::setprecision(4);
    std::cout << "Total return: " << totalReturn * 100 << "%\n";
    std::cout << "Max drawdown: " << maxDrawdown * 100 << "%\n";
    std::cout << "Mean period return: " << mean * 100 << "%\n";
    std::cout << "Volatility: " << volatility * 100 << "%\n";
    std::cout << "Sharpe-like ratio: " << sharpeLike << "\n";

    return 0;
}
```
Held Back Data
Testing a strategy on historical data that was intentionally held back from model design and parameter tuning is called ____ evaluation.
Friction Changes Reality
Costs punish unnecessary motion
A strategy can look strong before costs and weak after costs. This is especially true for fast models, noisy signals, and multi-timeframe systems that frequently flip direction.
Your backtest should account for at least:
- Commission: explicit fee per trade or per share
- Slippage: worse fill price than the candle price suggests
- Spread: difference between buy and sell prices
- Trade frequency: how often the model pays those costs
The small example below compares repeated position flips with and without friction.
```cpp
#include <iostream>
#include <vector>
#include <iomanip>

struct Result {
    double finalEquity;
    int trades;
};

Result runBacktest(const std::vector<double>& prices, bool useFriction) {
    double cash = 10000.0;
    int position = 0;
    int trades = 0;

    const double commission = useFriction ? 1.00 : 0.00;
    const double slippageRate = useFriction ? 0.001 : 0.000; // 0.10%

    for (size_t i = 1; i < prices.size(); ++i) {
        // Toy model: alternate between long and flat to expose cost impact.
        int target = (i % 2 == 1) ? 1 : 0;
        int delta = target - position;

        if (delta != 0) {
            double rawPrice = prices[i];
            double fillPrice = rawPrice;

            if (delta > 0) fillPrice = rawPrice * (1.0 + slippageRate); // buying worse
            if (delta < 0) fillPrice = rawPrice * (1.0 - slippageRate); // selling worse

            cash -= delta * fillPrice;
            cash -= commission;
            position = target;
            trades++;
        }
    }

    double finalEquity = cash + position * prices.back();
    return {finalEquity, trades};
}

int main() {
    std::vector<double> prices = {100, 101, 100.5, 102, 101.2, 103, 102.8, 104};

    Result clean = runBacktest(prices, false);
    Result realistic = runBacktest(prices, true);

    std::cout << std::fixed << std::setprecision(2);
    std::cout << "No-cost final equity: " << clean.finalEquity
              << " after " << clean.trades << " trades\n";
    std::cout << "With-friction final equity: " << realistic.finalEquity
              << " after " << realistic.trades << " trades\n";
    std::cout << "Friction cost impact: "
              << clean.finalEquity - realistic.finalEquity << "\n";

    return 0;
}
```
Read The Report
Treat results as a decision brief
A good performance review should tell a story that a future version of you can audit.
Before trusting a backtest, ask:
- Did the model only see data available at each decision time?
- Were costs, slippage, and execution timing included?
- Is the trade count large enough to mean anything?
- Does performance depend on one lucky trade or one market regime?
- Are drawdowns acceptable for the intended risk level?
- Does the strategy still behave on out-of-sample or segmented periods?
For your C++ trading stack, the practical output should be more than a final number. Save a trade log, an equity curve, and a metric summary. Those artifacts become the bridge between research and the deployment discipline you will study next.
The goal is not to prove the model is perfect. The goal is to decide whether it deserves the next round of engineering attention.