Data Science Interview Questions Cheat Sheet
Read at your own pace. Code execution, quizzes, progress tracking, and the AI tutor are available in the interactive view with JavaScript enabled.
Background
There's the expectation for Data Scientists who have done some initial research to readily be able to explain basic statistical terms (such as sampling, hypothesis testing, and variance vs. standard deviation). Similarly, you should have an understanding of the popular technical models and methodologies (such as Neural Networks, Bayesian Network, supervised machine learning, unsupervised and reinforcement learning, and much more).

But should you ask most Data Science enthusiasts what data science actually is, and you will find the majority of them lost. Terms like Data Mining, Big Data, Data Science, and Data Engineering all seem synonymous. This is because we lack the understanding that lies behind the emergence of these individual technologies. In future tutorials, we'll address the difference between these so-called synonymous terms. However, we'll restrict the scope of this tutorial.
This tutorial will help you out in identifying the terminologies and concepts that a professional Data Scientist must comprehend to crack an entry-level interview.
Some tips:
- Do not rush into answering the question. Rather, first, ensure that you understand the concepts that are relevant to the question. Only then try to answer the question.
- Even if you do not understand the question completely, make a habit of narrowing the answer choices, especially in multiple-choice questions, and then make an informed guess.
- This tutorial will guide you towards more realistic questions that are usually asked in interviews. You can maximize the output from this tutorial if you give us feedback on topics that you'd like to see.
Conceptual Questions
1. What is bias variance trade-off?
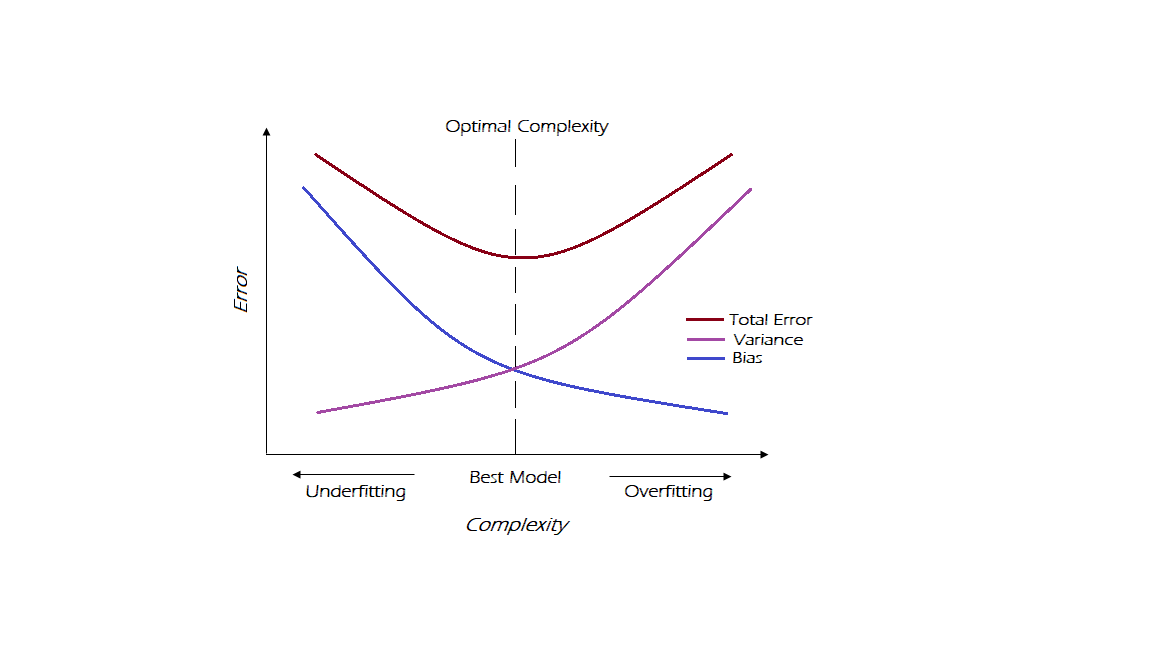
Bias and variance are known as prediction errors of a model. An oversimplified model leads to high bias, a measure of how far the predicted values of the model are from the correct values.
A more complex model can lead to high variance, meaning more variation in the predictions between model iterations. However, these two errors are inversely proportional to each other.
The goal of any supervised machine learning algorithm is to have low bias and low variance to achieve strong prediction performance. Therefore, a balance is maintained between these two and this is called the bias-variance trade-off.
2. How do we combat Over-fitting and Under-fitting?
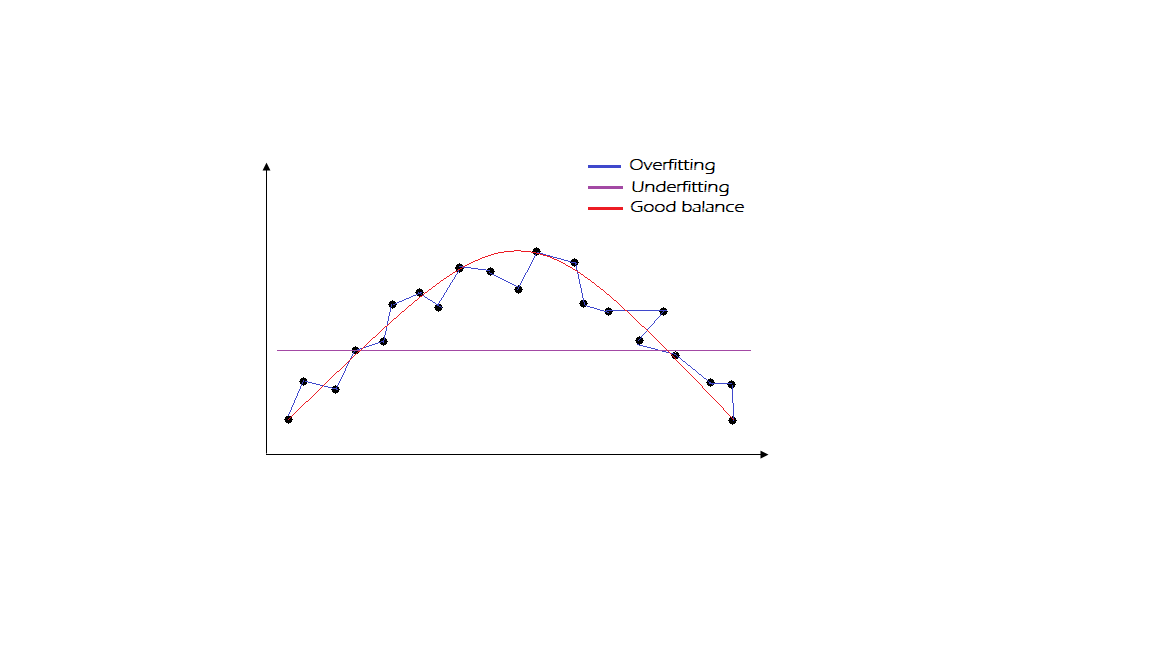
To combat overfitting and underfitting, you can resample the data to estimate the model accuracy (k-fold cross-validation) and by having a validation dataset to evaluate the model.
3. How would you effectively represent data with multiple dimensions?
We can use a method like a pair-wise correlation matrix or pair-wise scatter plot. Another common solution is to change the data and use traditional 2D and 3D data visualization techniques. There are 3 options to adjust the data:
- Feature selection
- Feature extraction
- Manifold learning
4. How is k-NN different from k-means clustering?
K-NN K-Means Unsupervised learning algorithm Supervised learning algorithm Use for Clustering Use for Classification It takes a bunch of unlabeled points and tries to group them into “k” number of clusters. It takes a bunch of labeled points and uses them to learn how to label other points.5. How would you validate a model you created to generate a predictive model of a quantitative outcome variable using multiple regression?
To model a qualitative dependent variable such as a simple yes/no,
we can use logistic regression.
The first step is to split the data in the ratio of 70-30 or 60-40. We can keep large data for building/training the model and use the rest to validate the trained model.
The final step is to review the residuals of your model on both sets of data and look at other parameters such as R squared and standard error.
Fill In 1
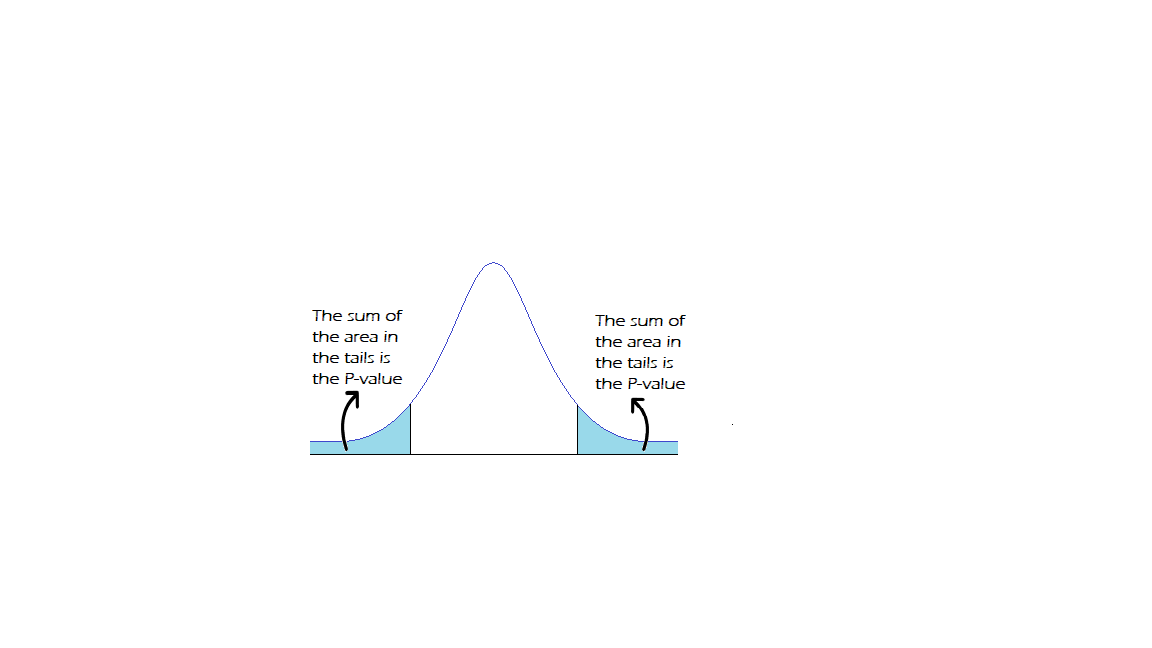
A low p-value ______ indicates strength against the null hypothesis, which means we can reject the null hypothesis.
Fill In 2
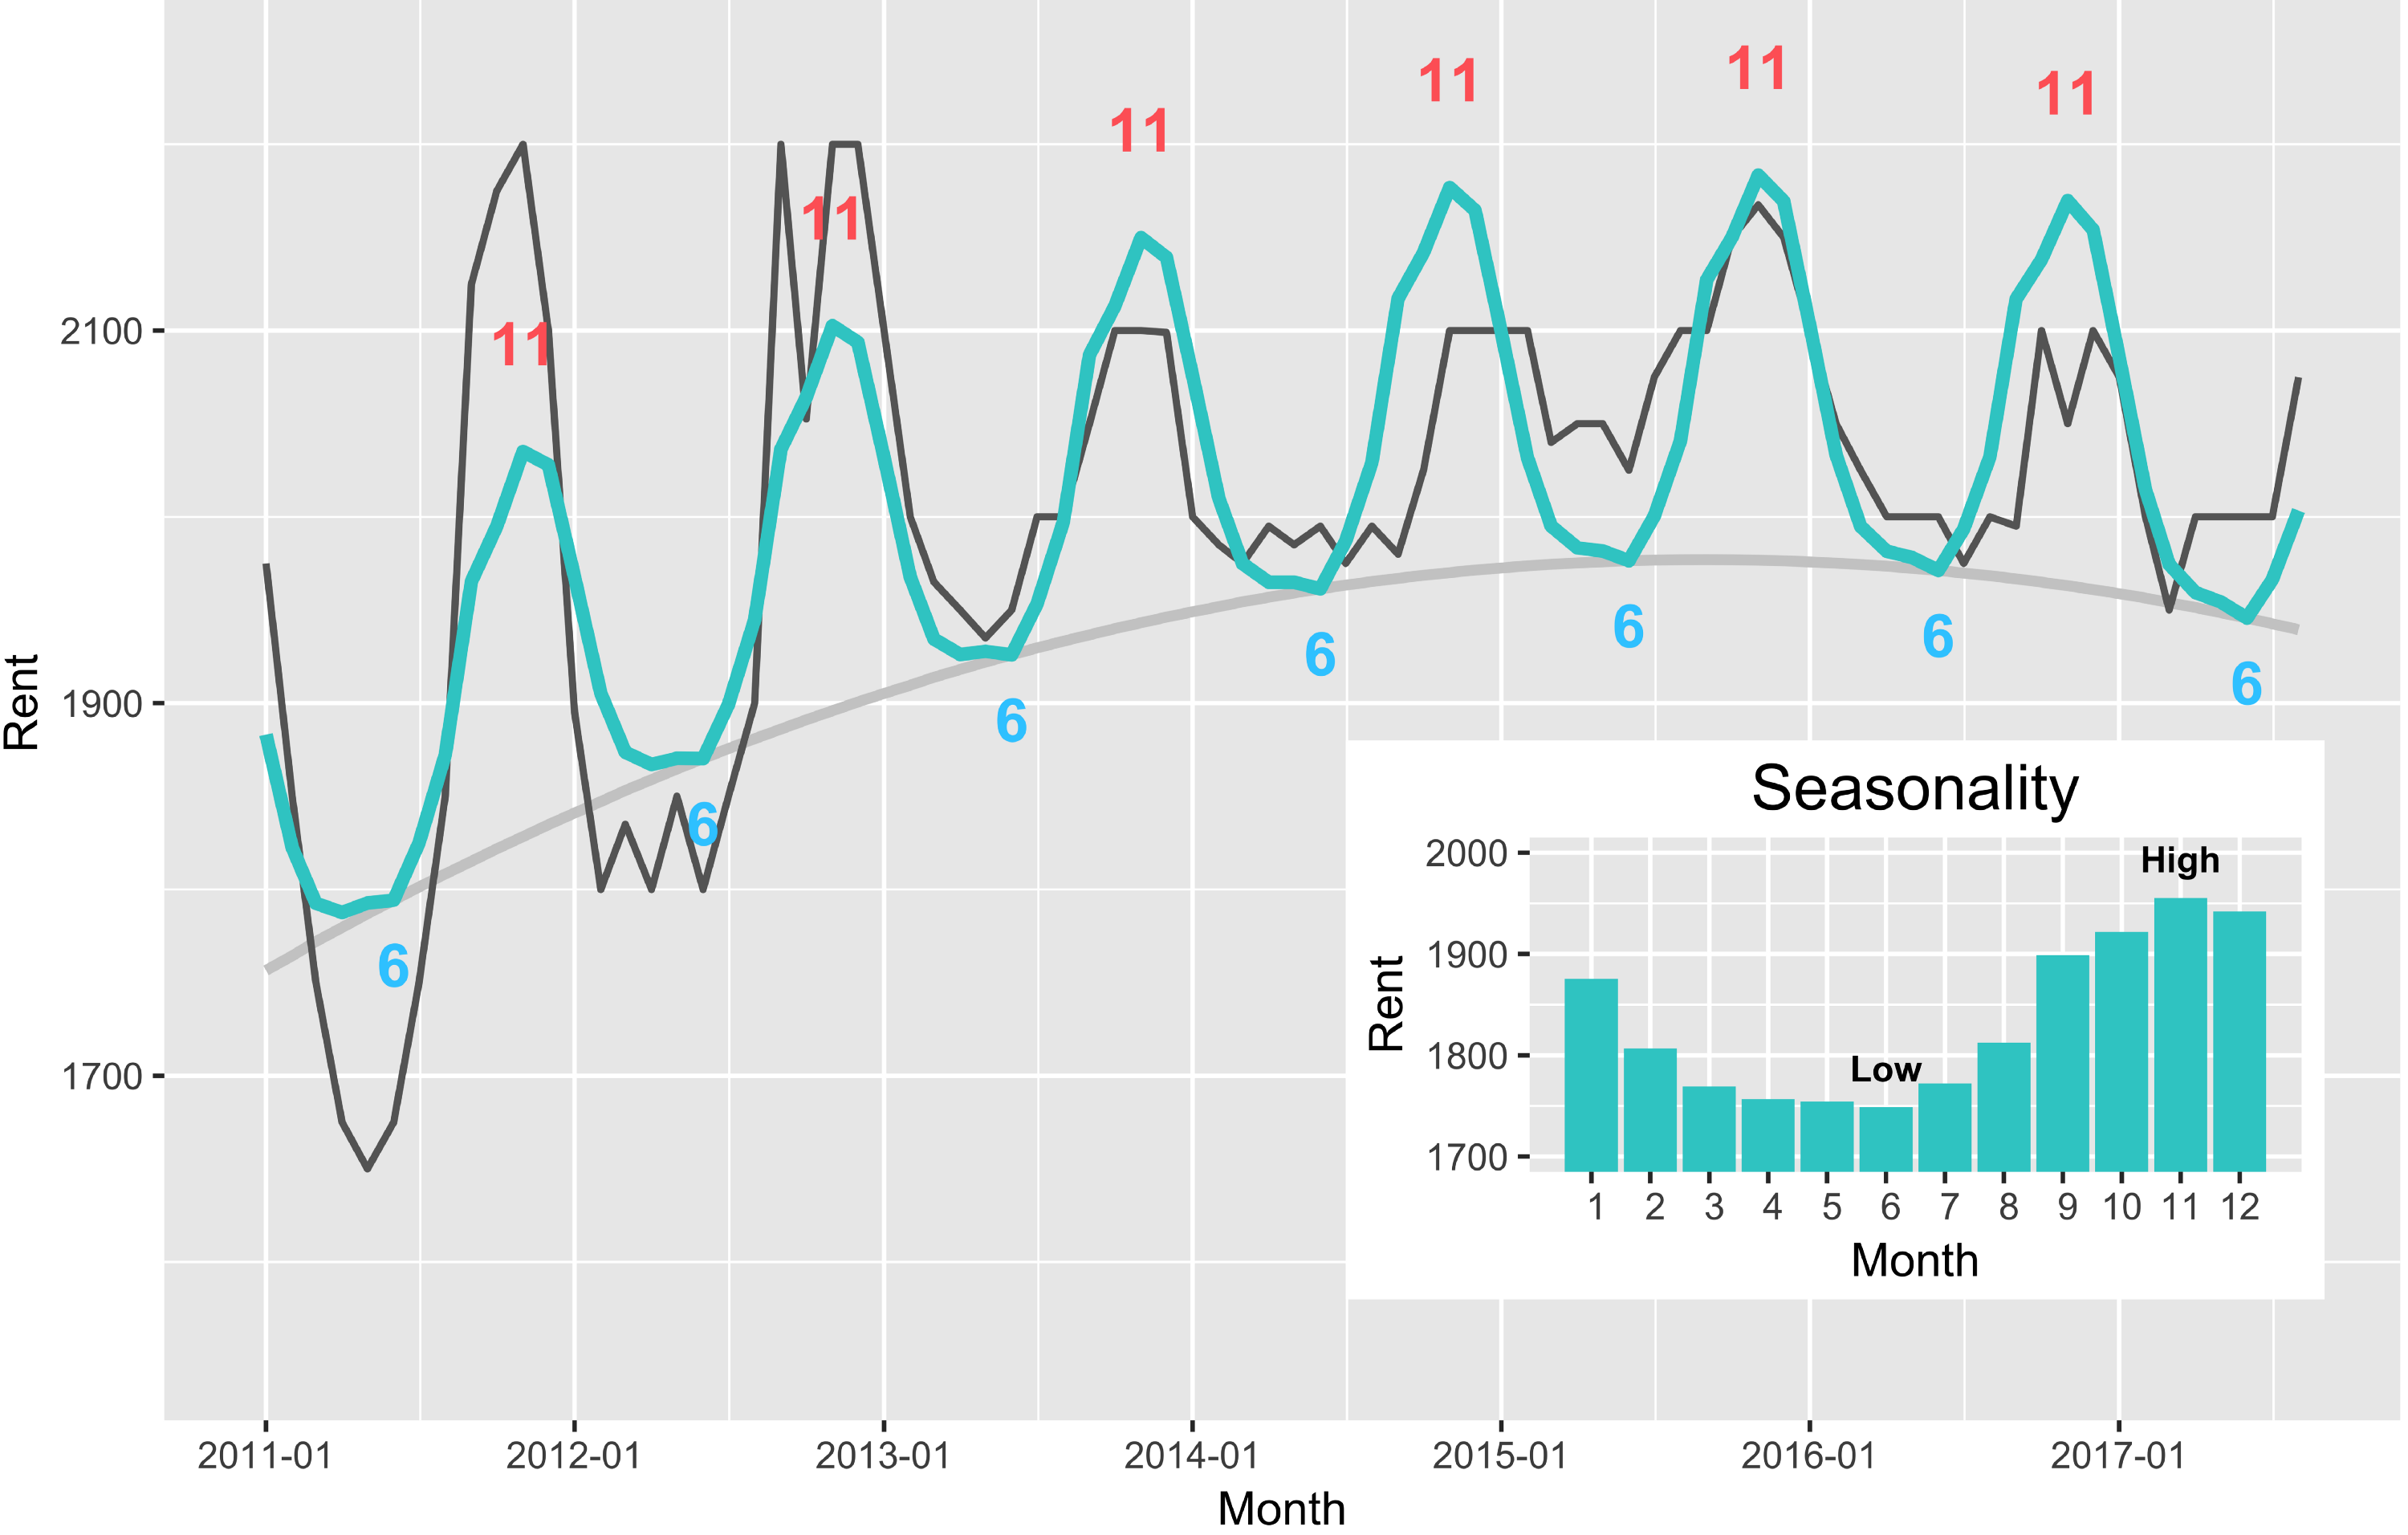
Differencing a time series is the best way to remove ______ from it.
Fill In 3
Sensitivity and Specificity are ________ to each other.
MCQ 1
A classifier that predicts if an image contains only a cat, a dog, or a llama produced the following confusion matrix:
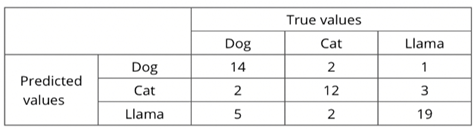
What is the accuracy of the model, in percentage?
fill in 5
An excellent model has AUC near to the _________ which means it has a good measure of separability.
T/F 1
Predicted labels usually match with all of the observed labels in real-world scenarios.
T/F 2
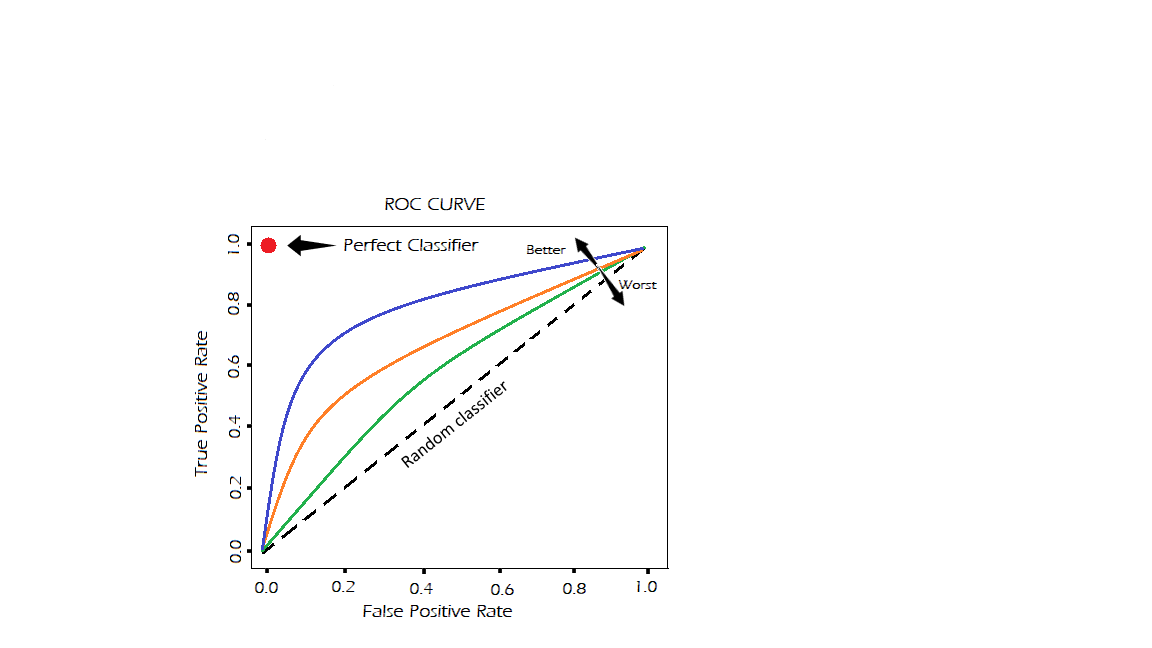
ROC is a probability curve.
T/F 3
We need to define an index in Pandas.
MCQ 2
You are carrying out primary market research to understand how many days in a week people generally do physical activities. You asked 3 of your friends. The answers you got were 2, 3, and 5. Based on this, which of the following is correct about the results you found?
MCQ 3
In simple linear regression, the goodness of fit...
MCQ 5
The mean of a Poisson distribution equals the mean of an exponential distribution only when the mean of the Poisson distribution equals...
T/F 7
K-means clustering is a useful technique to reduce the number of dimensions from 5 to 3.
T/F 5
A data scientist of high caliber should have competency in mathematics, stats, and computer programming.
T/F 8
In Python, the in method returns a boolean value.
MCQ 4
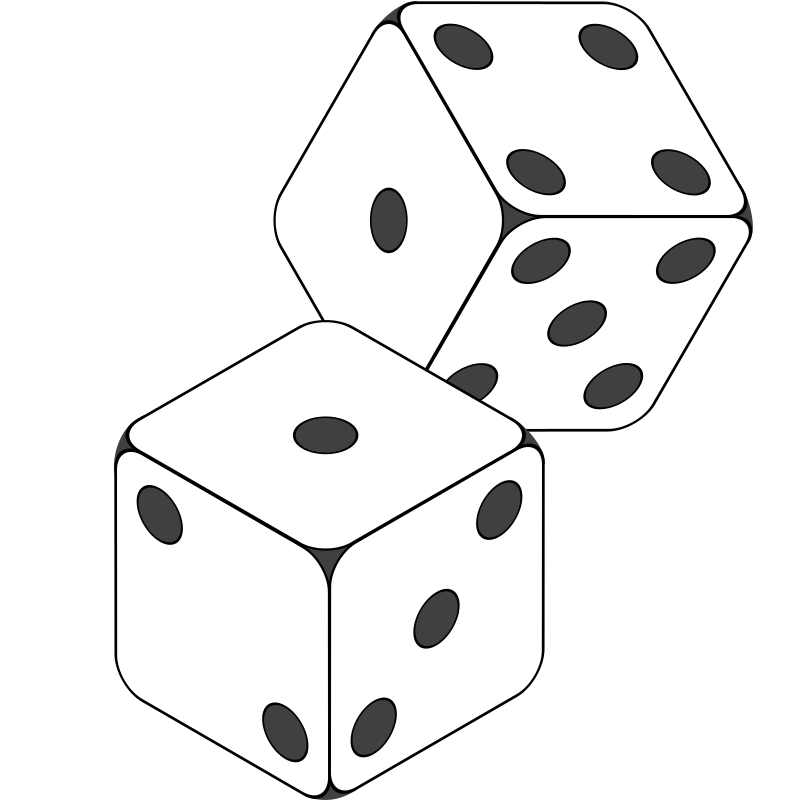
Assume all dices are fair, which of the following events is most likely?
T/F 4
In machine learning, predictive modeling works on labels.
T/F 6
The following slicing technique is right:
tuple[-4]
One Pager Cheat Sheet
One Pager Cheat Sheet
- This tutorial will provide you with the necessary knowledge to answer entry-level data science interview questions, as well as tips on understanding concepts, narrowing answer choices and getting feedback when needed.
- A
p-valueof ≤ 0.05 indicates that the results of an experiment are highly unlikely to have occurred by random chance, allowing the null hypothesis to be rejected and the alternate hypothesis to be accepted. - Differencing a time series is an effective way to
removeits seasonality by reducing its trend-like component and emphasizing its seasonal one. - The performance of a
binary classification modelis measured by two measures, Sensitivity (true positive rate) and Specificity (true negative rate) which are inversely proportional to each other. - The accuracy of this model can be calculated by taking the sum of the true positives and true negatives and dividing by the total number of observations (
15), resulting in an accuracy of75%. - The model's accuracy was calculated as 63.8% and its Area Under the Curve (AUC) was used to measure the model's ability to discriminate between two classes, with a value of 1.0 indicating a perfect classifier.
- The model predictions often differ from the actual results seen in a
real-worldenvironment, due to the possibility ofoverfittingorunderfittingleading to inaccurate predictions. - The
ROCplot displays the trade-off between the true positive rate (TPR) and false positive rate (FPR) of a binary classifier system. - It is not necessary to manually create the immutable array index when creating a
DataFrameinPandassince it is automatically generated. - The average mean of the responses from your three friends is 3.33, calculated by adding the responses and dividing by the total number, with the resulting
varianceof the sample being 2.33. - The goodness of fit in simple linear regression measures how
closelythe observed data pointsmatchthe model's predicted values, with a value of 1 indicating a perfect fit. - The means of a Poisson and an exponential distribution can never be equal since the Poisson mean corresponds to a whole number, while the exponential mean is determined by an equation involving the
rate parameter λ. - K-means clustering is a
machine learningalgorithm used for clustering data points into groups, but it does not actually reduce the number ofdimensions. - Data scientists play an essential role in managing and analyzing data, requiring a deep understanding of mathematics, statistics, and computer programming to effectively
develop statistical models,numerical simulations,data extraction processes, andvisualizationsto help explain the data. - The
inmethod returns a boolean value,TrueorFalse, which is essential for data scientists to analyze data sets and act on the presence of certain elements. - The
inmethod in Python returnsTrueorFalse, but cannot determine the probability of an event - in this case, rolling a certain number on a single dice is 1/6 for all given dices. - Predictive modeling in
Machine Learninguses features to make predictions, as opposed to labels, which are the actual classifications or outcomes being predicted. - Using the
negative indexand theslicing technique, the fourth item from the end of thetupleinPythoncan be returned.