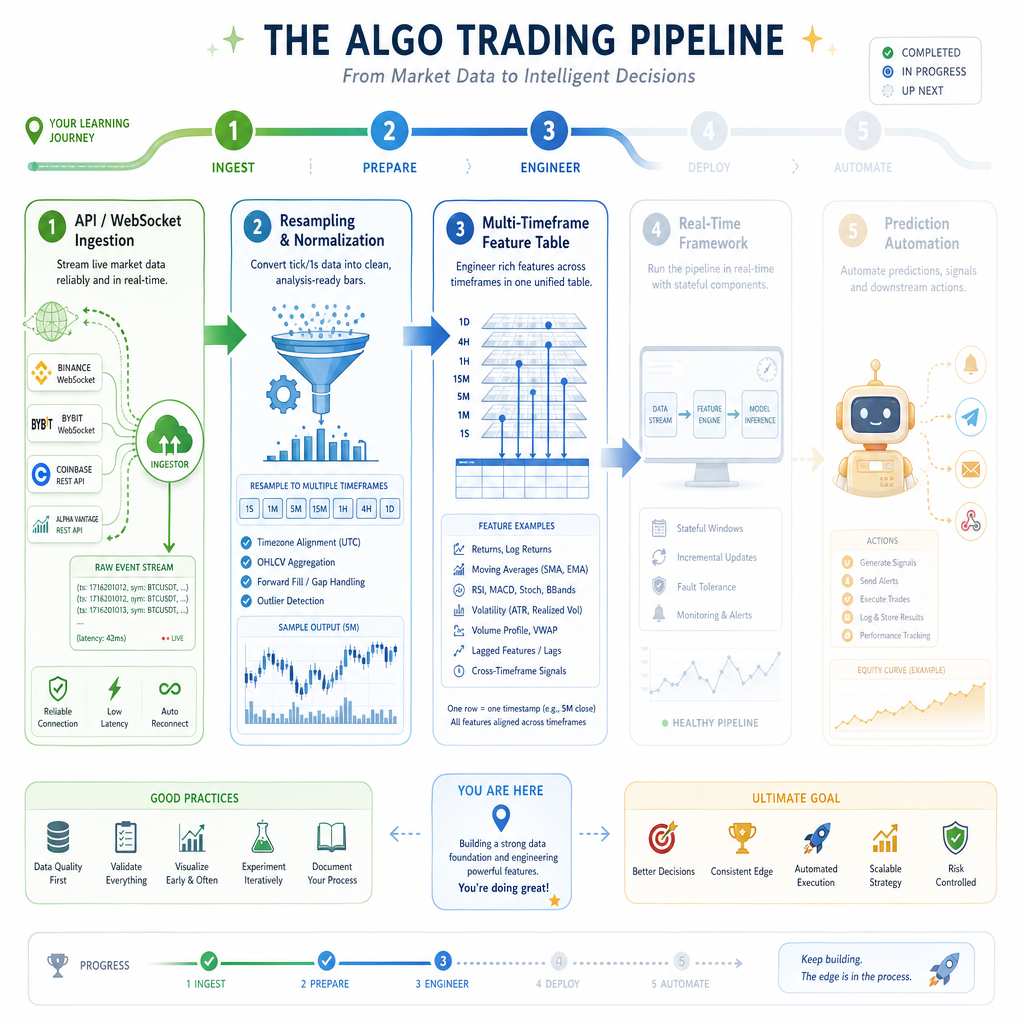
Resampling and Aggregating Time-Frame Data in R
Read at your own pace. Code execution, quizzes, progress tracking, and the AI tutor are available in the interactive view with JavaScript enabled.
From Ticks To Timeframes
Why this lesson matters
In Accessing and Streaming OHLC Data from APIs and Web-Sockets in R, you learned how market data enters your system: REST pulls, WebSocket streams, simulated live feeds, and quality checks.
Now we move to the next layer: turning second-level rows into trading timeframes.
Your real goal is not just: “Can I calculate a moving average?”
It is:
Can I maintain 30-minute and 60-minute calculations from second-level data, align them onto one row, and make them usable in real time?
This lesson focuses on the data engineering bridge between raw ingestion and the later trading/ML framework.

The Core Mental Model
Resampling is controlled compression
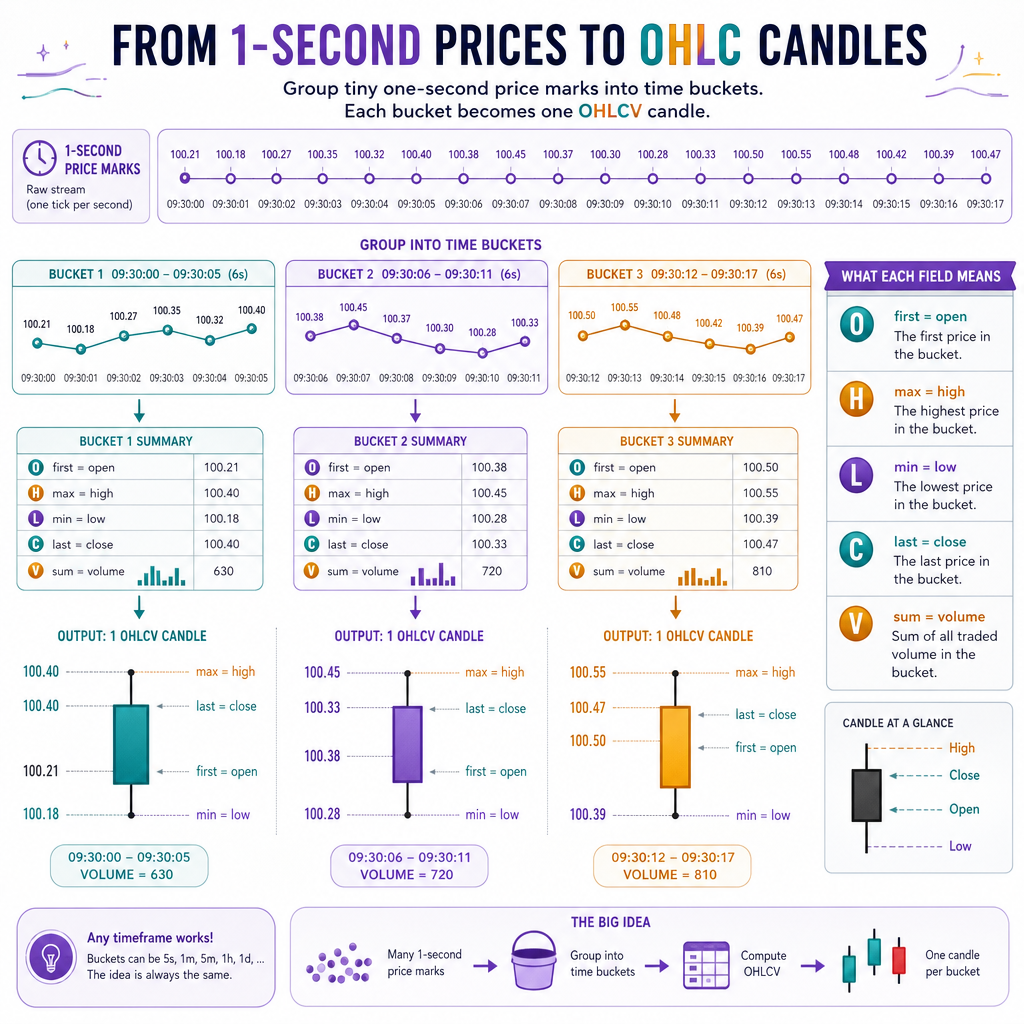
Second-level data is too granular for many indicators. Resampling compresses many smaller observations into one larger bar.
For OHLC, each timeframe bar is built like this:
open  = first price in the interval
high  = max price in the interval
low   = min price in the interval
close = last price in the interval
volume = sum volume in the interval
Example:
09:30:00 ... 09:59:59  ->  one 30-minute bar ending/starting at a boundary
10:00:00 ... 10:59:59  ->  one 60-minute bar
The key trading question is: which completed higher-timeframe value was known at the moment of each lower-timeframe row?
That question becomes critical when you combine 30-minute and 60-minute features without accidentally looking into the future.
Build OHLC Bars
From second rows to 30m and 60m bars
Below is a standalone Python example using pandas. The same idea maps directly to R tools like xts, data.table, or quantmod: set a timestamp index, group by time buckets, and aggregate OHLCV fields.
Important detail: this example uses label='right' and closed='right', meaning a bar timestamp represents the end of the interval.
That convention is usually easier for live trading because a 10:00 bar means: “this bar was completed at 10:00.”
```python
import pandas as pd
import numpy as np

np.random.seed(7)

# Simulate second-level trade/quote-derived data for 3 trading hours
idx = pd.date_range("2024-01-02 09:30:00", periods=3 * 60 * 60, freq="s")
price = 100 + np.cumsum(np.random.normal(0, 0.015, len(idx)))
volume = np.random.randint(1, 50, len(idx))

seconds = pd.DataFrame({"price": price, "volume": volume}, index=idx)

agg = {
    "price": ["first", "max", "min", "last"],
    "volume": "sum"
}

bars_30 = seconds.resample("30min", label="right", closed="right").agg(agg)
bars_30.columns = ["open", "high", "low", "close", "volume"]

bars_60 = seconds.resample("60min", label="right", closed="right").agg(agg)
bars_60.columns = ["open", "high", "low", "close", "volume"]

print("30-minute bars:")
print(bars_30.head())
print("\n60-minute bars:")
print(bars_60.head())
```
Choose The Boundary
You resample second-level data using bars labeled at the right edge of each interval.
What does a bar timestamped 10:00:00 most safely mean in a real-time trading system?
Twenty One What
21-period vs 21-day moving average
This distinction matters a lot.
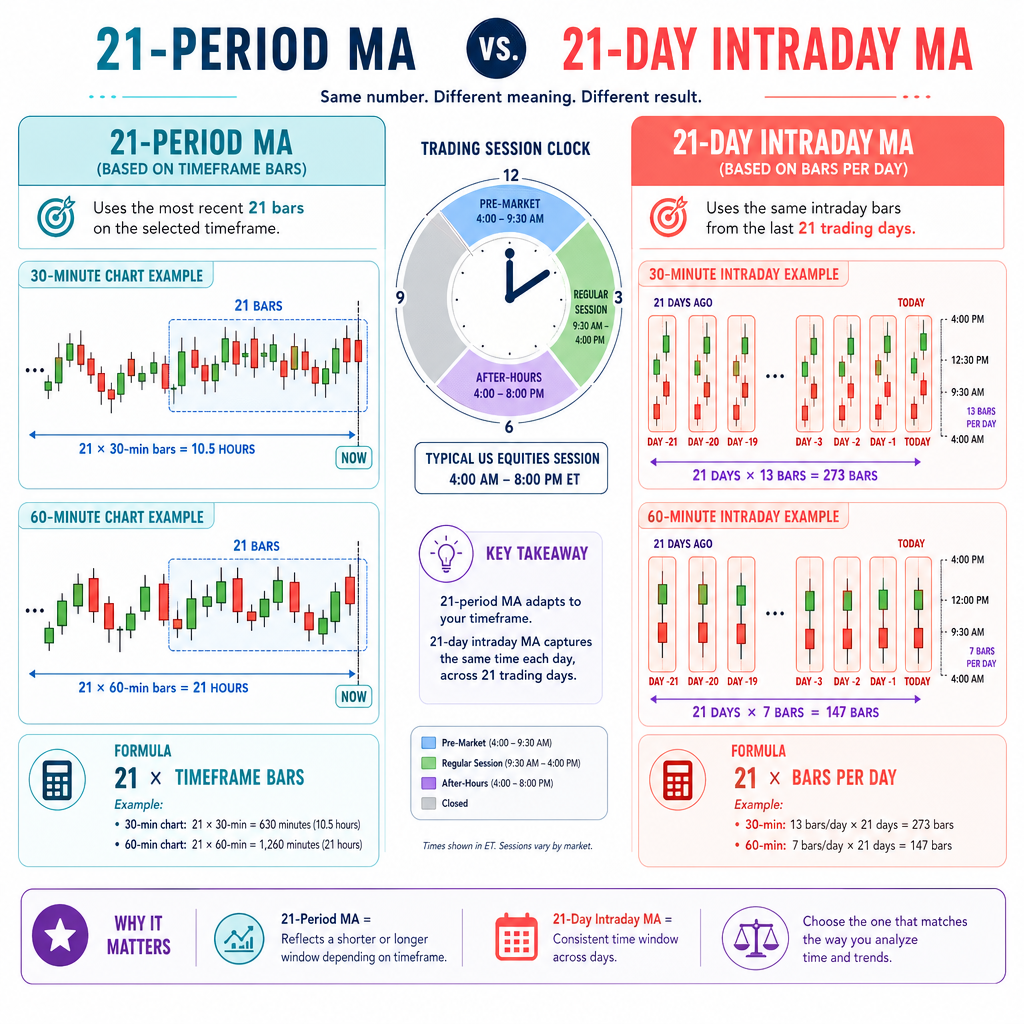
A 21-period moving average means 21 bars of the current timeframe:
30m 21-period MA = 21 × 30-minute bars
60m 21-period MA = 21 × 60-minute bars
A 21-day moving average on intraday bars means enough intraday bars to cover 21 trading days.
For a typical U.S. equity session:
6.5 trading hours/day = 390 minutes/day
30m bars/day ≈ 13
60m bars/day ≈ 6.5, often session handling creates 7-ish buckets depending on rules
So:
30m 21-day MA ≈ 21 × 13 = 273 bars
In real systems, session calendars and partial days matter. For this lesson, we will use 21-period moving averages to focus on resampling and alignment.
Align Multiple Timeframes
Put 30m and 60m features on one row
Once you have separate 30-minute and 60-minute bar tables, you need a single analysis table.
A common approach:
- Build 30m bars.
- Build 60m bars.
- Calculate indicators separately on each timeframe.
- Use an as-of join to attach the latest completed 60m value to each 30m row.
This avoids forcing both timeframes to have identical timestamps.
Example:
30m row at 10:30 uses latest completed 60m row at 10:00
30m row at 11:00 uses completed 60m row at 11:00
That is exactly the structure you need before the later real-time framework and prediction layer.
```python
import pandas as pd
import numpy as np

np.random.seed(11)

idx = pd.date_range("2024-01-02 09:30:00", periods=8 * 60 * 60, freq="s")
price = 250 + np.cumsum(np.random.normal(0, 0.025, len(idx)))
volume = np.random.randint(1, 80, len(idx))
seconds = pd.DataFrame({"price": price, "volume": volume}, index=idx)

def make_bars(df, rule):
    out = df.resample(rule, label="right", closed="right").agg({
        "price": ["first", "max", "min", "last"],
        "volume": "sum"
    })
    out.columns = ["open", "high", "low", "close", "volume"]
    return out.dropna()

bars_30 = make_bars(seconds, "30min")
bars_60 = make_bars(seconds, "60min")

bars_30["ma_30_21"] = bars_30["close"].rolling(21, min_periods=1).mean()
bars_60["ma_60_21"] = bars_60["close"].rolling(21, min_periods=1).mean()

left = bars_30.reset_index().rename(columns={"index": "timestamp"})
right = bars_60[["close", "ma_60_21"]].reset_index().rename(
    columns={"index": "timestamp", "close": "close_60"}
)

features = pd.merge_asof(
    left.sort_values("timestamp"),
    right.sort_values("timestamp"),
    on="timestamp",
    direction="backward"
)

features = features.rename(columns={"close": "close_30"})

print(features[["timestamp", "close_30", "ma_30_21", "close_60", "ma_60_21"]].tail(8))
```
Fill The Join
To attach the latest completed higher-timeframe row to each lower-timeframe row in pandas, the lesson used pd.merge_____.
Avoid Future Leakage
True or false?
If your 30-minute row is timestamped 10:30, it is safe to attach a 60-minute bar timestamped 11:00 because it is the next available 60-minute value.
Handle Live Updates
Completed bars vs forming bars
In a live stream, every new second updates the currently forming 30m and 60m buckets.
But most indicators should be calculated from completed bars unless your strategy intentionally uses partial-bar values.
A practical pattern is:
incoming second row
   -> update current bucket state
   -> if boundary crossed, finalize bar
   -> recalculate timeframe indicators
   -> refresh aligned feature row
The example below simulates this idea in batch form by progressively revealing data and printing only when a 30-minute bar completes.
```python
import pandas as pd
import numpy as np

np.random.seed(21)

idx = pd.date_range("2024-01-02 09:30:00", periods=95 * 60, freq="s")
price = 50 + np.cumsum(np.random.normal(0, 0.01, len(idx)))
volume = np.random.randint(1, 25, len(idx))
stream = pd.DataFrame({"price": price, "volume": volume}, index=idx)

def finalize_ohlcv(chunk):
    return {
        "open": chunk["price"].iloc[0],
        "high": chunk["price"].max(),
        "low": chunk["price"].min(),
        "close": chunk["price"].iloc[-1],
        "volume": chunk["volume"].sum()
    }

completed = []
last_boundary = pd.Timestamp("2024-01-02 09:30:00")

for boundary in pd.date_range("2024-01-02 10:00:00", "2024-01-02 11:00:00", freq="30min"):
    chunk = stream.loc[(stream.index > last_boundary) & (stream.index <= boundary)]
    bar = finalize_ohlcv(chunk)
    bar["timestamp"] = boundary
    completed.append(bar)

    bars = pd.DataFrame(completed).set_index("timestamp")
    bars["ma_30_3_demo"] = bars["close"].rolling(3, min_periods=1).mean()

    latest = bars.iloc[-1]
    print(f"Finalized 30m bar at {boundary}: close={latest['close']:.4f}, ma_30_3_demo={latest['ma_30_3_demo']:.4f}")
    last_boundary = boundary
```
Feature Table Check
You are building a table where each row is a 30-minute bar and you want to include the latest known 60-minute moving average.
Which design is safest for real-time trading?
Lesson Checkpoint
What you can do now
You now have the core transformation layer for dynamic algo trading:
- Convert second-level data into 30m and 60m OHLCV bars.
- Choose a clear bar timestamp convention.
- Calculate timeframe-specific moving averages.
- Align multiple timeframes into one feature table.
- Avoid future leakage with backward as-of joins.
- Separate completed bars from forming bars.
The big mental model:
raw seconds -> timeframe bars -> indicators -> aligned features
In the next lesson, Building a Real-Time Algorithmic Trading Framework in R, this resampling layer becomes part of a larger event-driven system with state, updates, and strategy hooks.