Anomaly Detection
What is an Anomaly
An Anomaly defined as:
Something that is different from what is usual or expected.
Detecting anomalies has many useful applications. For example anomaly detection enables us to detect cancer in MRI images, detecting credit card fraud, pricing glitches and much more.
Can you find the anomaly in the picture below?

So as you probably guessed, the red fish is the anomaly. It is different from the rest because it deviates from the established normal pattern of blue fish.
Let’s take another example. Using the last technique we would assume that the anomaly is the green car in the picture below since the rest of the vehicles are red.

However, you could also say the motorcycle is an anomaly if you were only familiar with seeing cars and trucks. This illustrates that we need to be able to define what an anomaly is for us.
Once we establish what is the norm it is easy to define what the anomaly is. We simply ask if the observation, which is this case is a particular vehicle, fits the normal pattern.
Types of Anomalies
When it comes to outlier analysis the first step is knowing what type of anomaly you are up against. Being able to accurately categorize outliers sharpens the focus of automated anomaly detection and yields much better result. Here we have three categories to categorize anomalies.
Global Outliers
A data point or points are considered to be a global outlier if their values are far outside everything else in the dataset.
For example, the exponential spike in Zoom usage at the start of the pandemic is an example of a global outlier when comparing those numbers to the pre-COVID user base. This is an example of a dream global outlier for a business.
Contextual Outliers
A data point is considered to be a contextual outlier if its value deviates significantly from the rest of the data points that are in the same context. However that same data point may not be considered an outlier if it occurs in a different context.
Let's look an example, there is a sudden surge in order volume of a TV at an eCommerce company in the middle of the night. It's a contextual outlier because you wouldn't expect this high volume to occur outside daytime. Upon further inspection the business finds a pricing glitch where someone has entered the price of the TV as €6.99 rather than the actual price of €400. This example is actually a true story from Darty, a famous French electrical retailing company.

Collective outliers
A group of data points are considered collective outliers when they are significantly different from the rest of the entire dateset. However each data point on its own wouldn't be considered anomalous in either a contextual or a global sense. Individually the time series behavior doesn't deviate significantly from the normal range however when when the time series are combined they indicate a bigger issue.
Let's take an example, imagine you're running an ad campaign. As your budget increases you will expect to see an increase in both impressions and ad clicks. However the actual result seen is an increase in the number of impressions but a decrease in the number of ad clicks. In this case either the increase in impressions or the drop in ad clicks is not abnormal but when they happen together it suggests that you have an issue with your campaign. Perhaps you are serving an empty ad or you're serving to the wrong audience.
Are you sure you're getting this? Click the correct answer from the options.
In 2017, the Nasdaq exchange listed stock prices of tech giants Apple and Microsoft as $123.45 for an extended period of time. Given that publicly traded stocks are never a static thing and this was over a period of time, what type of outlier was this?
Click the option that best answers the question.
- Global Outlier
- Contextual Outlier
- Collective Outlier
How do we find Anomalies in our Time Series Data?
Manually
Simply by looking at the data and detecting with your eyes. Using a time series chart it is relatively easy to find where the data deviates from the pattern.
However this method is simply not practical because it needs us to constantly watch it and is also prone to human error.
Automatically with Machine Learning (ML)
Using ML algorithms, the systems learns the normal patterns in the data. As a result it can then detect any anomalies. Unlike manual or simple statistic methods, ML minimizes false positives by scaling the provided data in real time.
Although the cost to implement and maintain them is high, it is the most scalable, most accurate and the fastest solution
Anomaly Detection with ML

Unsupervised Learning
This is the most common method of anomaly detection. The ML model is trained using an unlabelled dataset. Therefore there is an assumption that the majority of the data in the dataset are normal examples. Any data that differs significantly from the normal behavior will be flagged as an anomaly.
Supervised Learning
Is a less common method since this process requires a large number of positive and negative examples which is difficult since anomalous examples are rare.
Are you sure you're getting this? Click the correct answer from the options.
A banking institution wants to make a marketing campaign. It's aim is to encourage it's existing customers to subscribe to their deposit accounts by calling them and pitching the service.
The banks dataset is as seen below. What method of learning will the model undergo?

Click the option that best answers the question.
- Unsupervised
- Supervised
Anomaly Detection using Python
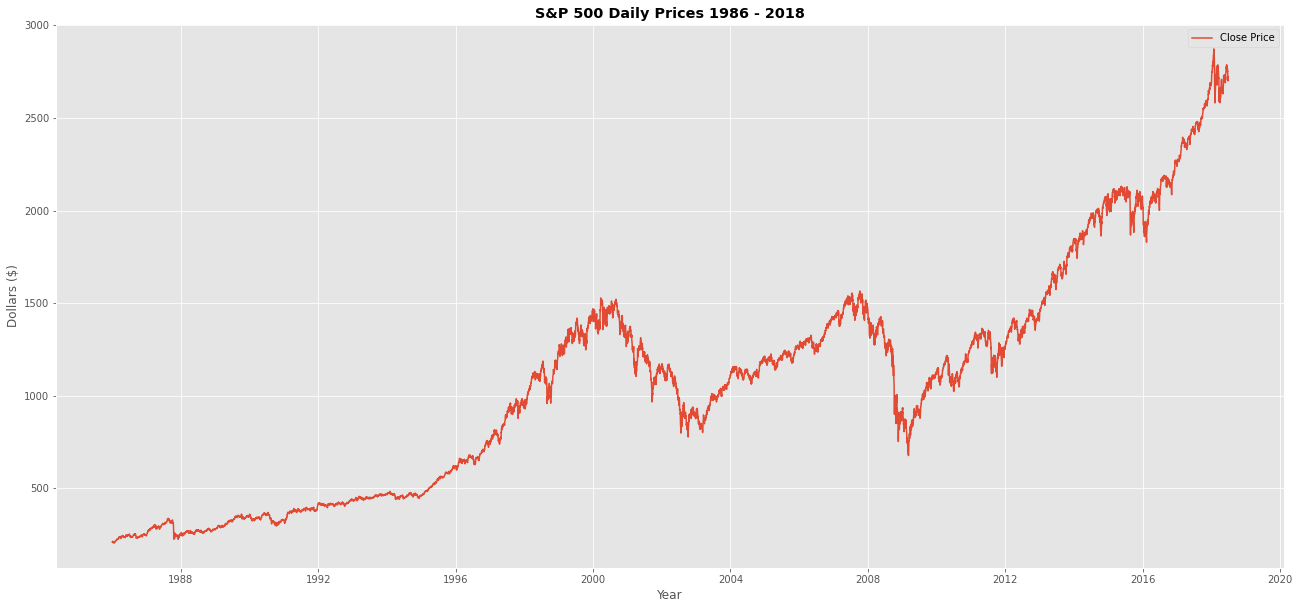
In this example we will be using a dataset which contains details of the closing prices for S&P 500 index from 1986 to 2018.
We are going to create a Long Short-Term Memory Network (LSTM) Model.
Step 1: Import Libraries
1import numpy as np
2import tensorflow as tf
3from tensorflow import keras
4import pandas as pd
5import seaborn as sns
6from pylab import rcParams
7import matplotlib.pyplot as plt
8from matplotlib import rc
9from pandas.plotting import register_matplotlib_converters
10from sklearn.model_selection import train_test_split
11from sklearn.preprocessing import StandardScaler
12rcParams['figure.figsize'] = 22, 10
13
14RANDOM_SEED = 42
15np.random.seed(RANDOM_SEED)
16tf.random.set_seed(RANDOM_SEED)
Step 2: Upload the Dataset
In this example we will be using a dataset that can be downloaded from Kaggle.
1anomaly_df = pd.read_csv('/content/spx.csv', parse_dates=['date'], index_col='date')Step 3: Manual Anomaly Detection
1fig = plt.figure()
2plt.style.use('ggplot')
3
4ax = fig.add_subplot()
5
6ax.plot(anomaly_df, label='Close Price')
7
8ax.set_title('S&P 500 Daily Prices 1986 - 2018', fontweight = 'bold')
9
10ax.set_xlabel('Year')
11ax.set_ylabel('Dollars ($)')
12
13ax.legend()
Step 4: Splitting the Dataset into Training & Testing
In this example, we are choosing to split the data into two parts:
- 95% training data, to train our machine to learn the normal patterns in the data
- 5% testing data, to evaluate the machine.

1train_size = int(len(anomaly_df) * 0.95)
2test_size = len(anomaly_df) - train_size
3train, test = anomaly_df.iloc[0:train_size], anomaly_df.iloc[train_size:len(anomaly_df)]
Step 5: Preparing the Data
First we will scale and reshape our data for the ML model.
1scaler = StandardScaler()
2scaler = scaler.fit(train[['close']])
3
4train['close'] = scaler.transform(train[['close']])
5test['close'] = scaler.transform(test[['close']])1#Create helper function
2def create_dataset(X, y, time_steps=1):
3 Xs, ys = [], []
4 for i in range(len(X) - time_steps):
5 v = X.iloc[i:(i + time_steps)].values
6 Xs.append(v)
7 ys.append(y.iloc[i + time_steps])
8 return np.array(Xs), np.array(ys)
9
10TIME_STEPS = 30
11
12# reshape to [samples, time_steps, n_features]
13
14X_train, y_train = create_dataset(train[['close']], train.close, TIME_STEPS)
15X_test, y_test = create_dataset(test[['close']], test.close, TIME_STEPS)Step 6: Create the Model
1model = keras.Sequential()
2
3#encoder
4model.add(keras.layers.LSTM(
5    units=64,
6    input_shape=(X_train.shape[1], X_train.shape[2])
7))
8model.add(keras.layers.Dropout(rate=0.2))
9
10#decoder
11model.add(keras.layers.RepeatVector(n=X_train.shape[1]))
12
13model.add(keras.layers.LSTM(units=64, return_sequences=True))
14model.add(keras.layers.Dropout(rate=0.2))
15
16model.add(keras.layers.TimeDistributed(keras.layers.Dense(units=X_train.shape[2])))
17
18model.compile(loss='mae', optimizer='adam')
19model.summary()
Step 7: Train the Model
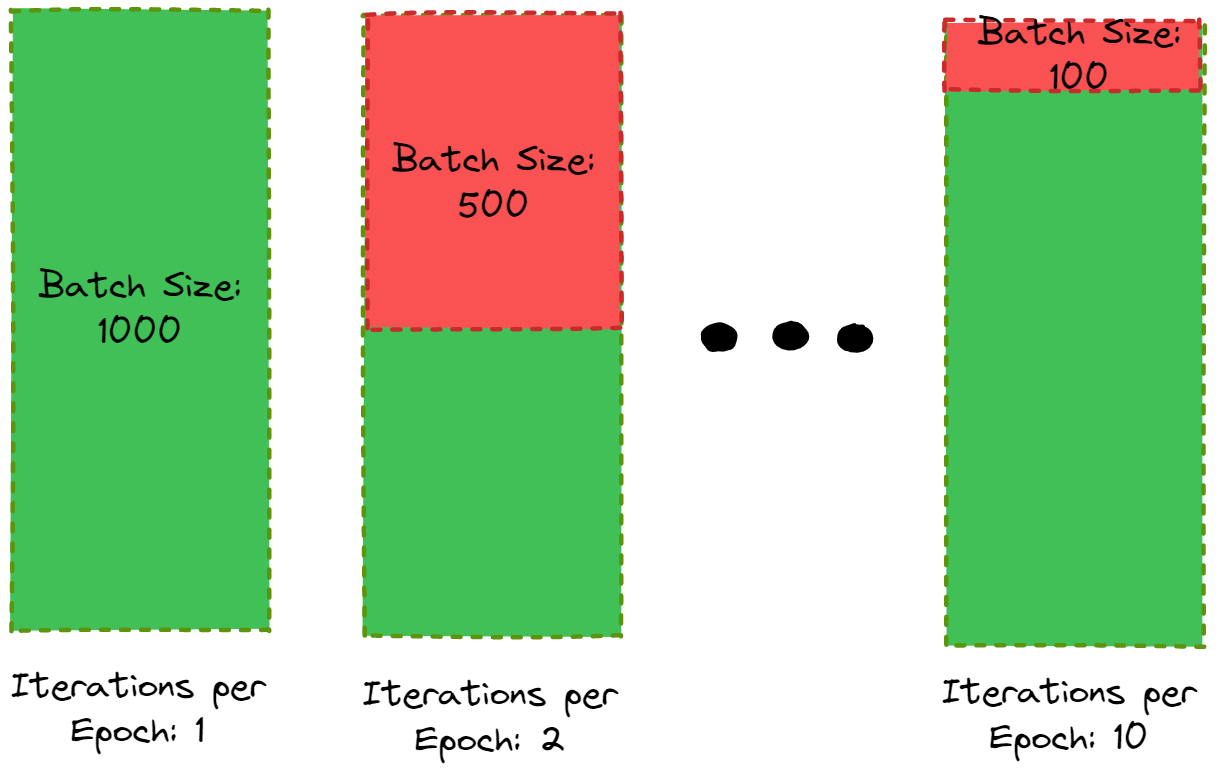
To create our model we need to decide on the most appropriate batch size and number of Epochs, changing these values will vary our models performance.

1history = model.fit(
2    X_train, y_train,
3    epochs=10,
4    batch_size=32,
5    validation_split=0.1,
6    shuffle=False
7)
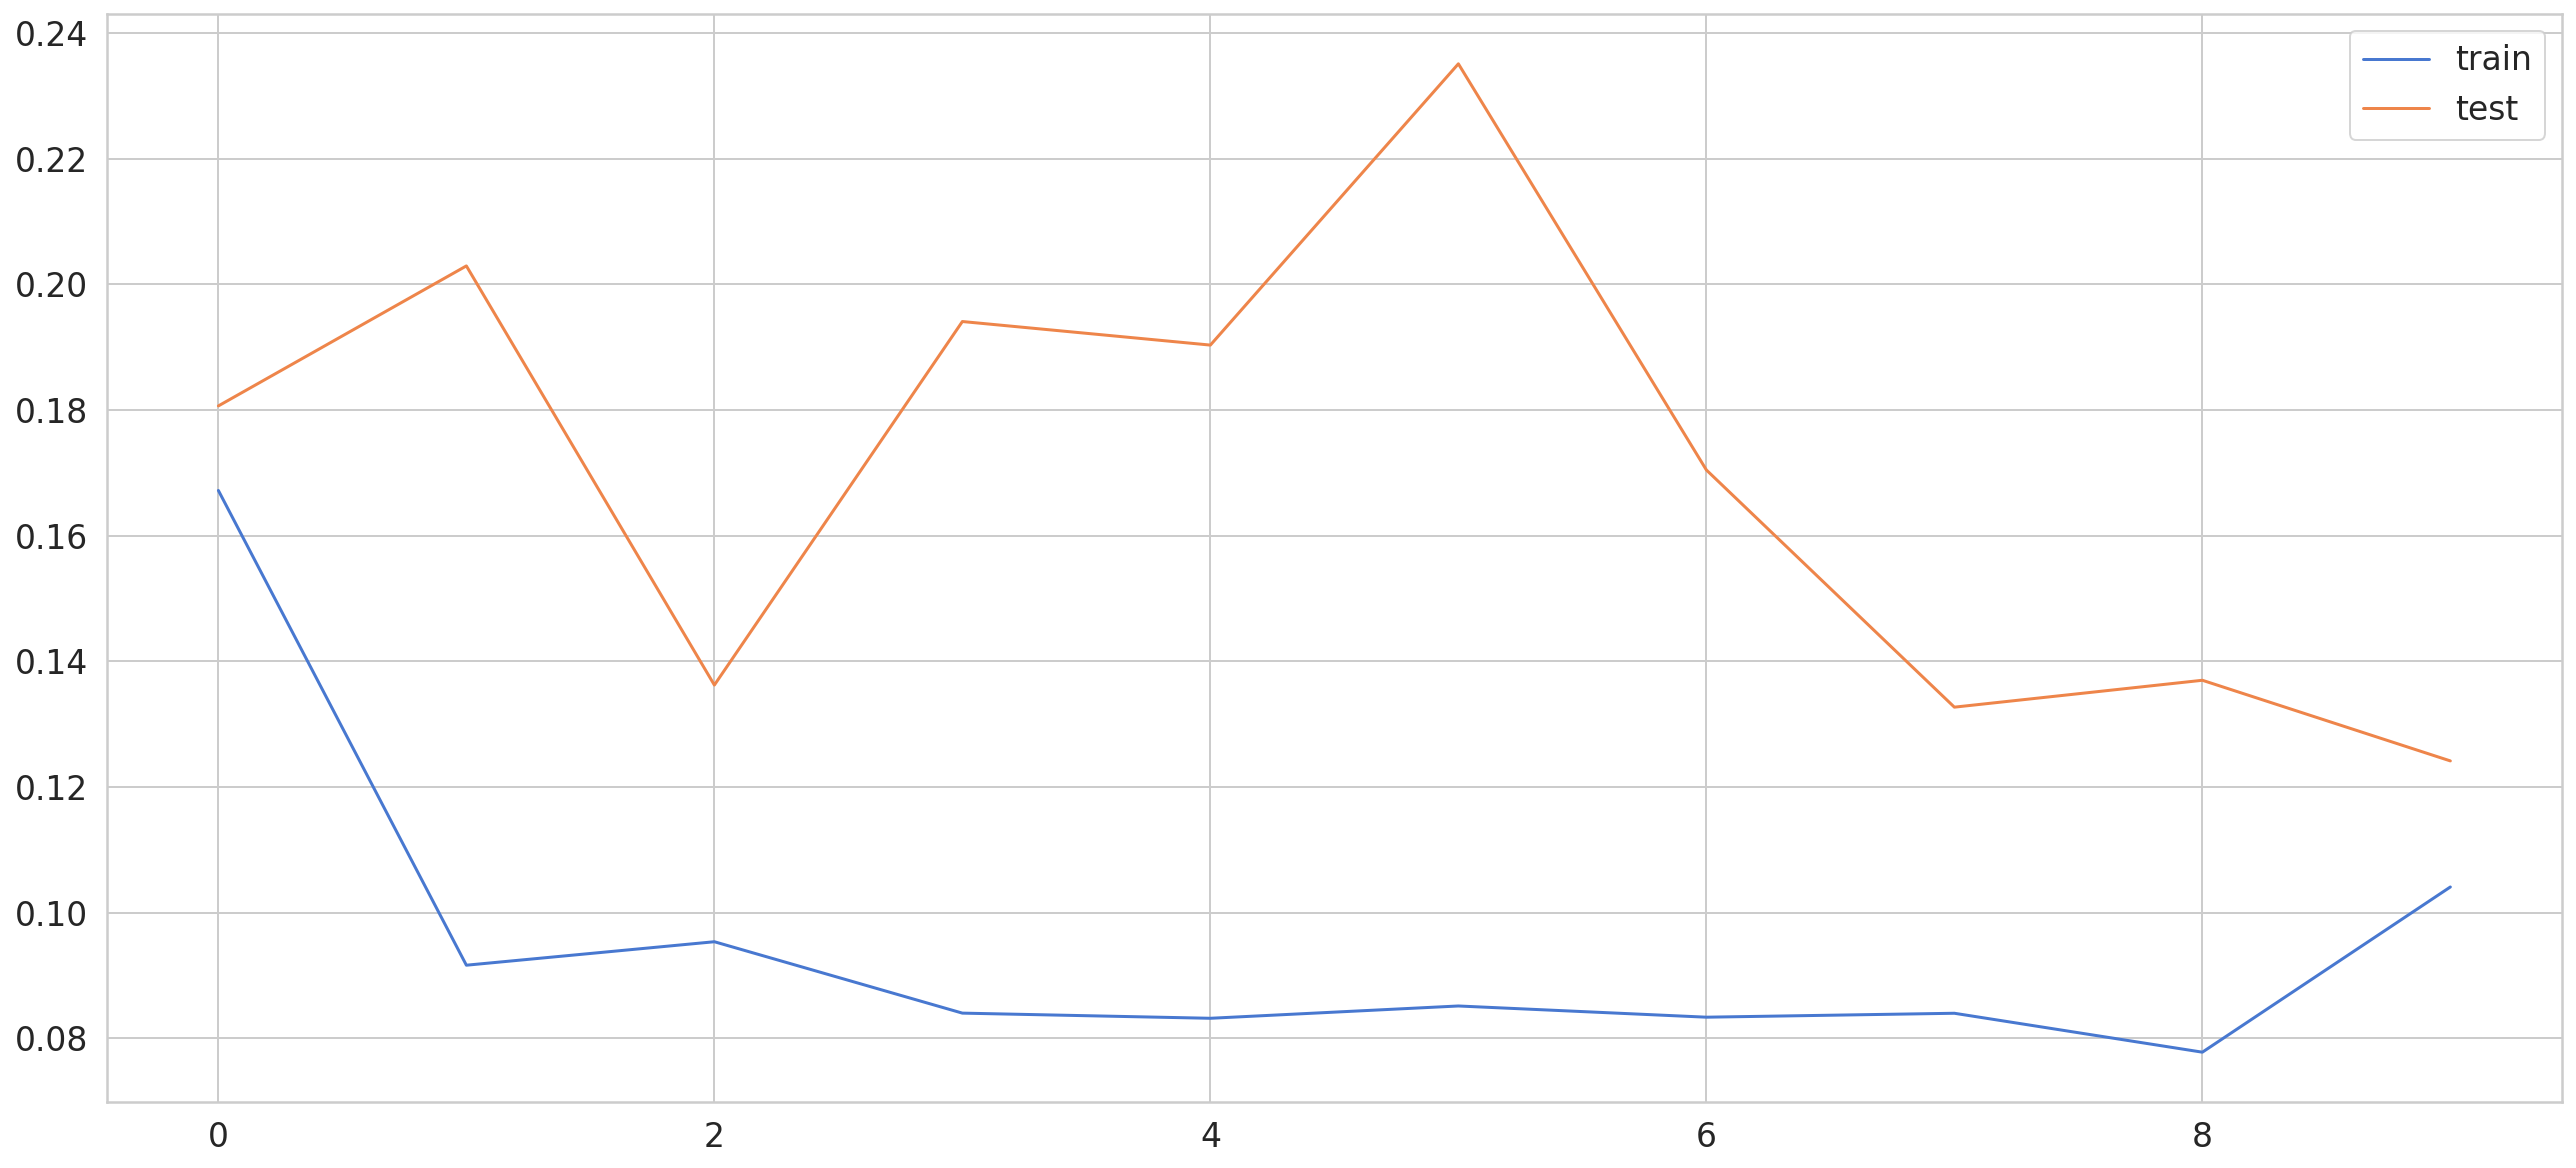
To decide what is the suitable number of epochs we can visualize the result from our model.
1fig = plt.figure()
2ax = fig.add_subplot()
3
4ax.plot(history.history['loss'], label='train')
5ax.plot(history.history['val_loss'], label='test')
6
7ax.legend()
Step 8: Defining the Anomaly Value
First we will calculate the loss between the predicted and the actual closing price data:
1X_train_pred = model.predict(X_train)
2
3train_mae_loss = np.mean(np.abs(X_train_pred - X_train), axis=1)
We will then plot the loss distribution to decide on the threshold for our anomaly detection.
1fig = plt.figure(figsize=(20,10))
2sns.set(style="darkgrid")
3
4ax = fig.add_subplot()
5
6sns.distplot(train_mae_loss, bins=50, kde=True)
7
8ax.set_title('Loss Distribution Training Set ', fontweight ='bold')
Calculate the Mean Absolute Error
1X_test_pred = model.predict(X_test)
2
3test_mae_loss = np.mean(np.abs(X_test_pred - X_test), axis=1)
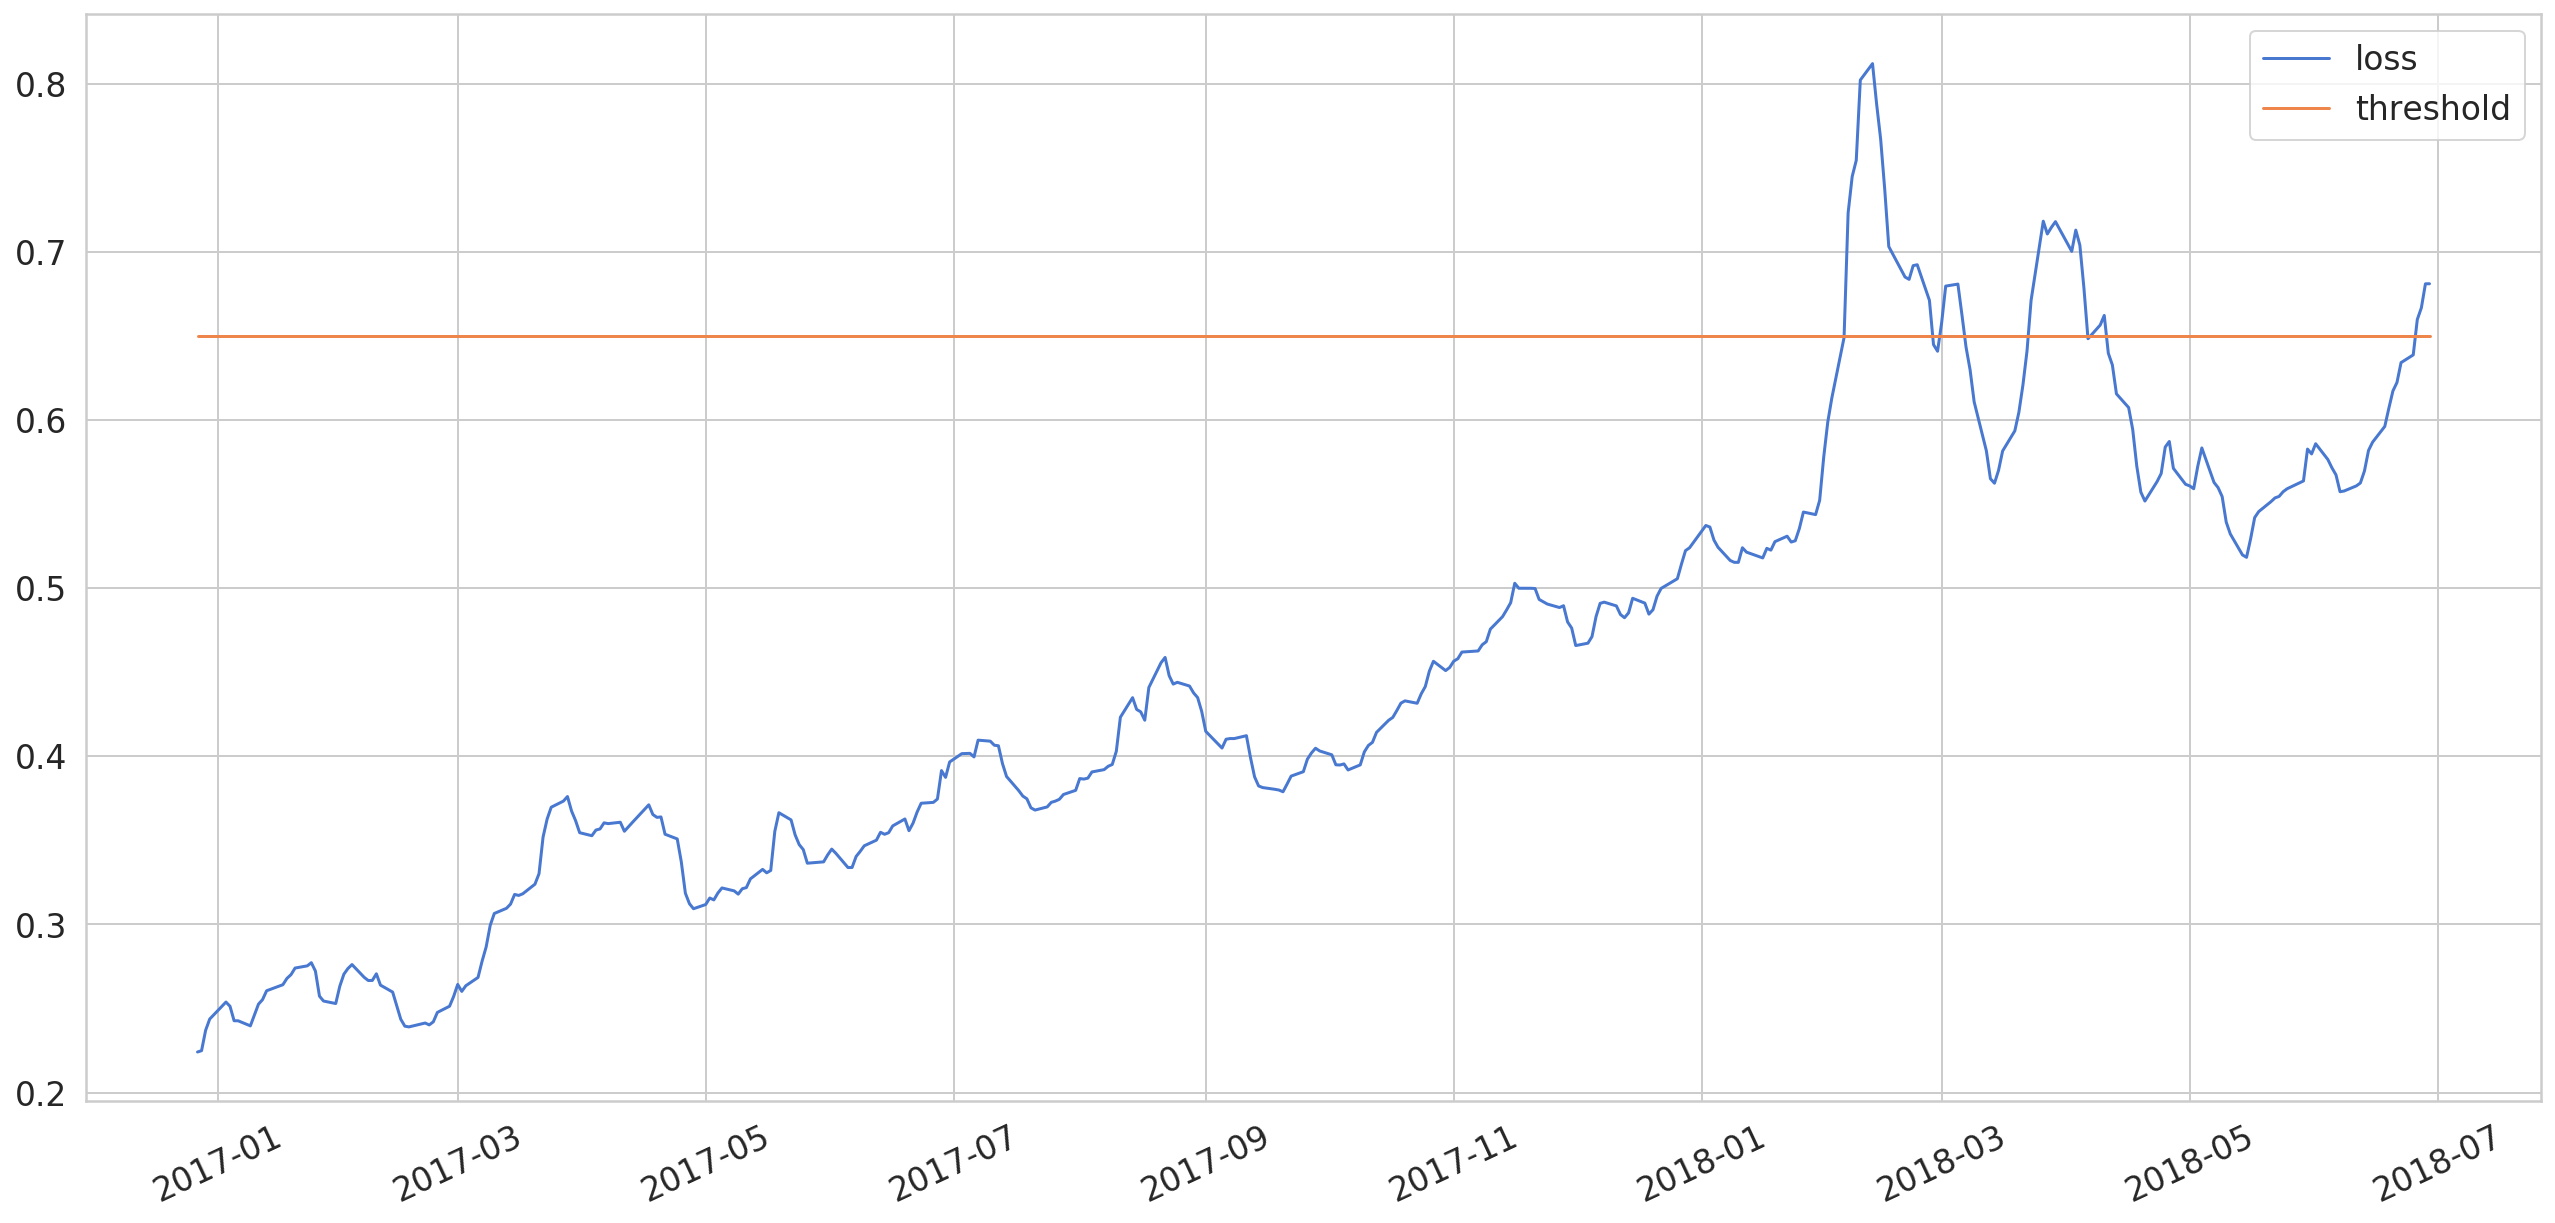
In this example we are using a threshold of 0.65
1THRESHOLD = 0.65
2
3test_score_df = pd.DataFrame(index=test[TIME_STEPS:].index)
4test_score_df['loss'] = test_mae_loss
5test_score_df['threshold'] = THRESHOLD
6test_score_df['anomaly'] = test_score_df.loss > test_score_df.threshold
7test_score_df['close'] = test[TIME_STEPS:].close1fig = plt.figure()
2
3ax = fig.add_subplot()
4
5ax.plot(test_score_df.index, test_score_df.loss, label='loss')
6ax.plot(test_score_df.index, test_score_df.threshold, label='threshold')
7
8ax.legend()
1anomalies = test_score_df[test_score_df.anomaly == True]
2anomalies.head()
And finally our anomaly detection.
1fig = plt.figure()
2
3ax = fig.add_subplot()
4
5ax.plot(test[TIME_STEPS:].index,
6  scaler.inverse_transform(test[TIME_STEPS:].close.values.reshape(1,-1)).reshape(-1),
7  label='close price')
8
9sns.scatterplot(anomalies.index, scaler.inverse_transform(anomalies.close.values.reshape(1,-1)).reshape(-1), color=sns.color_palette()[3],
10  s=52,label='anomaly')
11
12ax.legend()
We can change our anomaly threshold which will enable our model to detect more or less anomalies depending on your businesses criteria.
Are you sure you're getting this? Is this statement true or false?
The model we created was a Unsupervised learning example?
Press true if you believe the statement is correct, or false otherwise.
Conclusion
Anomaly detection involves identifying data points in the data that doesn't fit the normal pattern. Using ML methods we can automate this process making it more effective especially when large datasets are involved.
One Pager Cheat Sheet
- Anomaly Detection is when we define what is usual or expected in a given situation and then, based on that, determine whether an observation fits the established normal pattern or not.
- Anomaly detection involves accurately categorizing outliers into Global Outliers, Contextual Outliers, and Collective Outliers to yield improved results.
- Collectively, Apple and Microsoft stock prices deviate significantly from the rest of the dataset, creating a
collective outlier; however, individually the stock prices are not unusual. - Inspecting the data manually is simple, yet not practical and prone to human error, while using Machine Learning algorithms to detect anomalies is a costlier yet more accurate, faster, and scalable solution.
- Anomaly Detection with ML can be done using either Unsupervised or Supervised Learning, with Unsupervised Learning being the most common method.
- The ML model can be trained to distinguish normal data from anomalous data using supervised learning with
labelled data. - We implemented an Long Short-Term Memory Network (LSTM) Model and used Manual Anomaly Detection techniques to find anomalous data points in an S&P 500 Daily Prices 1986 - 2018 dataset.
- We used
Unsupervised Learningto cluster the data and detect anomalies without any human intervention. - Anomaly detection
automatesthe process of identifying unusual data points in a dataset using Machine Learning methods, making it efficient for larger datasets.

